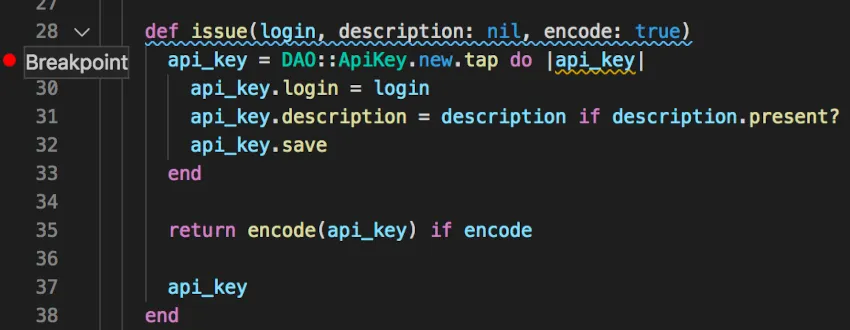
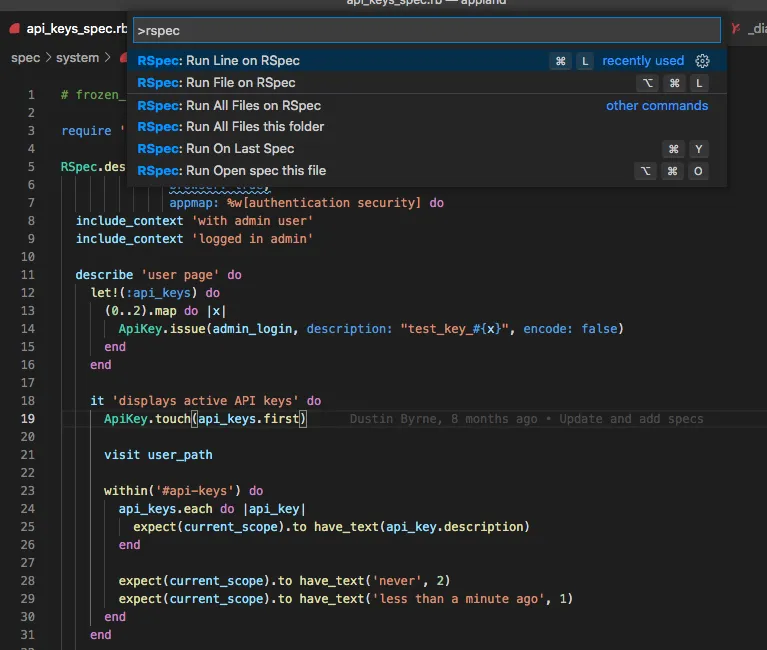
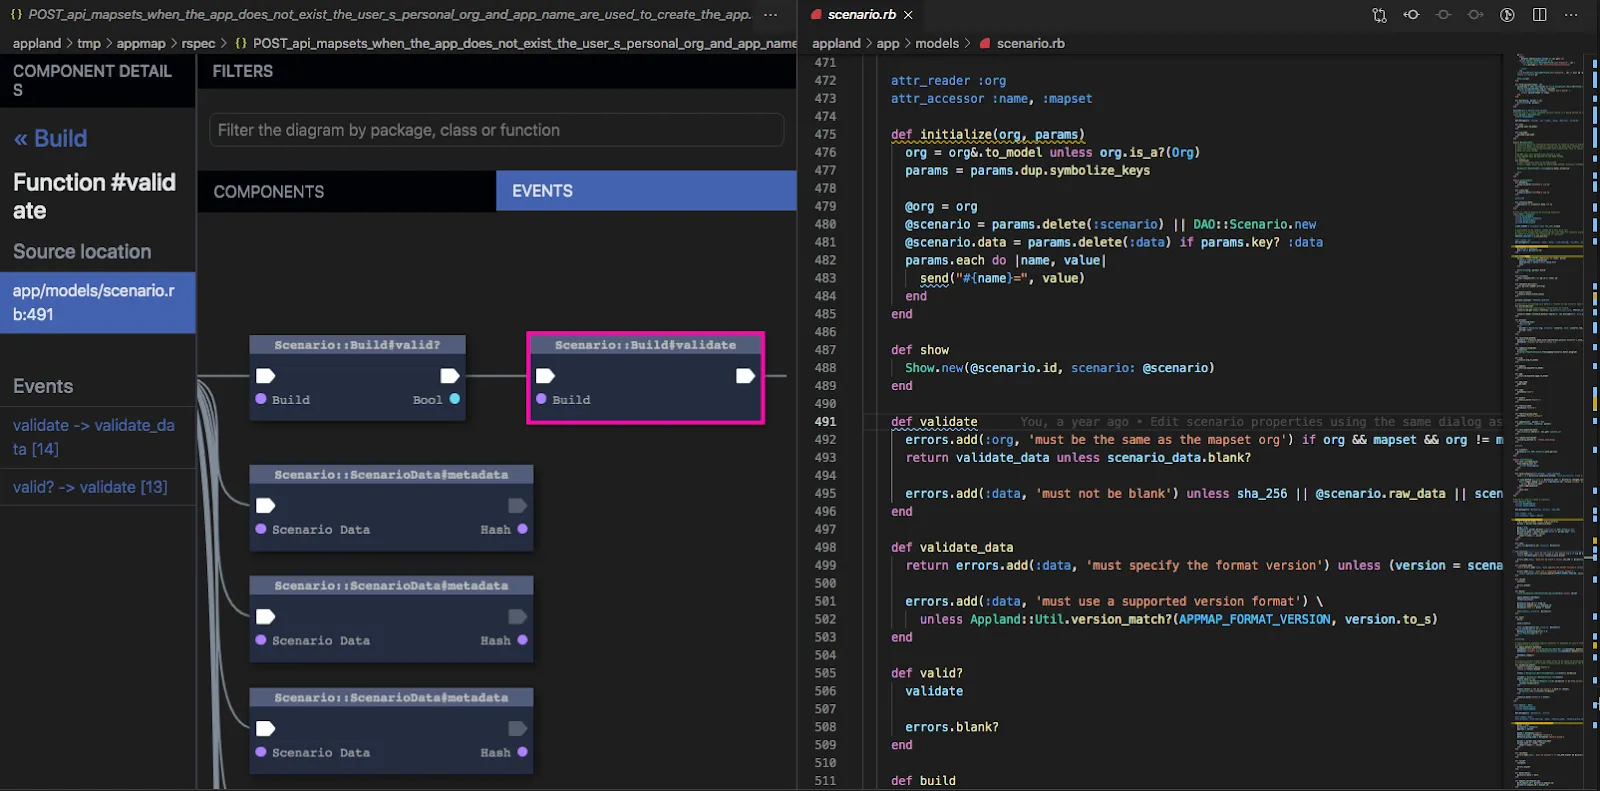
You’ve got a bug to fix. You’ve got the code, you’ve got a development environment, you’ve got everything setup in VSCode. You’re ready to start adding breakpoints and digging in. The problem is… where to start? Debuggers are great for inspecting the behavior of code within a particular function, or small neighborhood of related functions. But they don’t point you in the right direction when you first start an investigation of a bug.

A breakpoint will tell me exactly what’s going on in the code. But how am I supposed to know where to put it?
Maybe you already know exactly where to look. But, maybe you don’t. Maybe you’re new to the project, or getting back into it after a hiatus, or maybe it’s just large, complex, and dynamic. Maybe the bug isn’t even in this app, but rather in a dependency service. You’re facing “unknown unknowns”, so, where to begin?
The solution you’re looking for is “pre-debugging”, using the AppMap extension for VSCode. A pre-debugger provides an overview of all the code involved that might be contributing to the bug, and helps you figure out where things are going awry. You can quickly navigate around the source code, knowing which code is relevant to the bug, and which code isn’t. And you can see variable values, HTTP server and client requests, and complete SQL queries. In many cases, you won’t even need the debugger; just the AppMap and your rubber ducky.
To fix the bug using the AppMap pre-debugger, you’ll follow a five-step process:
- Reproduce the bug in a test case.
- Record the test case using the AppMap agent, creating an AppMap.
- Open the AppMap in VSCode
- Use the rich interactive diagrams to figure out where to set your breakpoints.
- [optional] Run the test again in the debugger to pinpoint the cause.
Let’s go through these steps in detail.
Step 1: Reproduce the bug in a test case
When you fix the bug, you’ll need to have a test case to demonstrate that the buggy behavior has been eliminated. So, why wait? Write that test case now, and make sure it has an assertion that fails.
If you can’t reproduce the bug, then don’t start wasting your time trying to fix it. Maybe it’s not a bug at all? Insist on getting enough information about the problem that you can write a clean reproduction.
Step 2: Record the test case using the AppMap client, creating an AppMap.
You’ve got the test case which is failing due to the presence of the bug. Great! You’ve probably done half the work already. The next step is to run the test case with AppMap enabled.
In case you don’t know, an AppMap is a data file which contains an end-to-end behavioral trace.
Note: You can find a full description of the AppMap format at https://github.com/getappmap/appmap.
of a program. Each AppMap is a tree of code execution, with threads separated into independent sub-trees. Each node in the tree is an “event”, which has a subtype such as:
- HTTP server request
- Function call
- SQL query
- HTTP client request

A failing test case is the best way to start fixing a bug
Like a debugger, an AppMap contains variable names and values. Unlike a debugger, you can explore the code execution in any order you like. You can jump forwards, backwards, up, down. All the data is pre-recorded, so you can view any event you like, in any order.
Step 3: Open the AppMap in VSCode
The AppMap framework provides full-featured interactive diagrams for viewing, searching and exploring AppMap Diagrams, and the AppMap VSCode extension brings this functionality right into the VSCode environment.

The AppMap extension provides a smooth pre-debugging user experience
Step 4: Use the rich interactive diagrams to figure out where to set your breakpoints.
The visual AppMap is helpful for debugging in two ways. First, when you look at the Component diagram, you’re only seeing the classes and packages that are actually involved in the buggy code path. So, you can step through the control flow starting from the highest level and drilling down into the details, and you can jump into source code at any point. The Component diagram is like an automatic table of contents of all the code that matters for the bug.

Code flow, variable values, SQL, and source code, all integrated together
Second, when you spot something in the code flow that looks useful or suspicious, you can jump over to the Events view. Here you can see all the details of the functional call tree, and you can see details such as:
- Variable values
- HTTP server and client requests
- Request status codes and headers
- SQL queries

If there’s a problem with this flow, you definitely need to get to the bottom of it…
It’s often possible to spot the bug from this information alone. But if you can’t quite figure out where the bug is happening, the source code which is linked from the diagrams provides ideal places to set breakpoints.
Step 5: Run the test again in the debugger to pinpoint the cause
Now you’ve got a test case that reproduces the bug, and you’ve got a good idea of where to set breakpoints in order to pinpoint the problem. Run the test case again, and see if your hypothesis checks out. Or… just think the problem over, knowing what you’ve learned about the code flows that are relevant to the bug. Tell your rubber duck all about the puzzle you’re trying to solve. Never accept that anything in code happens “randomly” (aside, of course, from random number generation!). Dig down until you find the root cause.
Finding and fixing the bug will be satisfying, and when you submit your pull request along with a test case, you’ll have a great feeling of satisfaction for a job well done.
Happy debugging!
The AppMap team
