At AppMap, we make a free and open source tool called AppMap for VSCode that helps developers deliver high quality code by providing better insights into code design and behavior. But even though code design is our company mission, we still make the same mistakes as everyone else!
In a series of posts, I am going to share five code design mistakes that we’ve made in the last three months. In each post, I’ll provide enough detail that you’ll know exactly what happened. I’ll also discuss how we discovered the problem, how we fixed it, and how we responded by improving our development and code review processes. My aim is to provide you with information and suggestions that you can use to avoid making some of these same errors!
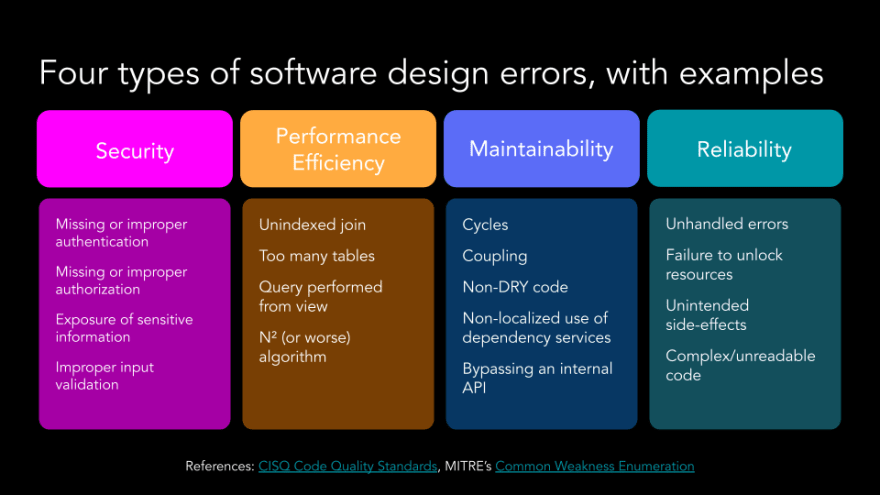
Before we get into the first example, let’s take a look at the nature of code design mistakes. First, we find it helpful to divide these issues into four categories: performance, stability (bugs), security, and maintainability.

- Security bugs allow attackers to disrupt service, and inflict reputational damage on you. Security problems can also result in direct and indirect damage to users (e.g. by locking them out of their account, or stealing their data).
- Performance problems can degrade the user experience, and even make the app unavailable.
- Maintainability problems don’t generally affect the app directly, although when code becomes unmaintainable, it generally suffers in all other aspects of quality. Unmaintainable apps are also difficult and expensive (and annoying) to work on. Senior developers worry about maintainability a lot, because they know that if they let maintainability degrade, the app will degrade in all other areas as well, and team morale will suffer.
- Reliability problems also affect the UX, and can make the app unavailable.
Over the last decade or so, static analysis tools have been able to automatically detect some problems in these four areas. However, the MITRE list of Top 25 Most Dangerous Software Weaknesses contains the following statement about the four weaknesses that have moved farthest up the list:
All four of these weaknesses represent some of
the most difficult areas to analyze a system on.
Digging into the list a little bit, what they mean by “difficult to analyze” is “not findable by static analysis”. That means that developers can’t rely on static analyzers to maintain code quality. The best tool we have to find and fix complex problems is code review, and that’s why better code review practices feature prominently in the recommendations that we give for each of our examples.
With that in mind, let’s get to our first mistake.
1. We knocked out our own site with a slow query (Performance)
This mistake made it into production, and we had to roll back and fix it
Slow queries can be a real problem. Not only can user experience be degraded, but if the site performance is bad enough, web servers and gateways will time out (typically after about 30 seconds) and the app becomes completely unavailable. Our AppMap Server product contains about 1 million AppMap files totaling about 1 TB of data. This isn’t FAANG scale, but it’s still big enough that inefficient queries can cause problems. It happened to us…
One fine day, after an update, we discovered that the homepage of our app was frequently timing out. Using MiniProfiler, we discovered that a slow query was causing the problem. Then, we used the PostgreSQL EXPLAIN feature to analyze the query.
Remediation
Every team needs someone who can read query plans and optimize queries, and we do have such a person. Once we had the query plan, our database expert was able to determine that the root of the problem was an unindexed join. To say that in English, our query correlates data from two tables together. In the beginning, when our database was small, the query was fast and nobody noticed that it was inefficient (inefficient operations are fast anyway, on small data sets!). As the tables grew larger and larger, the query grew slower and slower, since we weren’t providing the database with an index that it could use to efficiently match up the rows. Adding the index was basically an instant fix. This is Databases 101, frankly. But still, when building a new app, it’s pretty easy for something like this to slip through the cracks.
Prevention
Maybe you aren’t a PostgreSQL query plan expert. I’m not either. But to avoid introducing a bad performance bug, you really only need to know two things about query plans:
- The query plan on production data is the one that matters. Seeing a fast and efficient query plan on a dev or stage database doesn’t really mean anything.
- The cost number is the one to pay attention to. If that doesn’t look good to you; don’t ship the query! Find an expert to help you optimize the SQL.
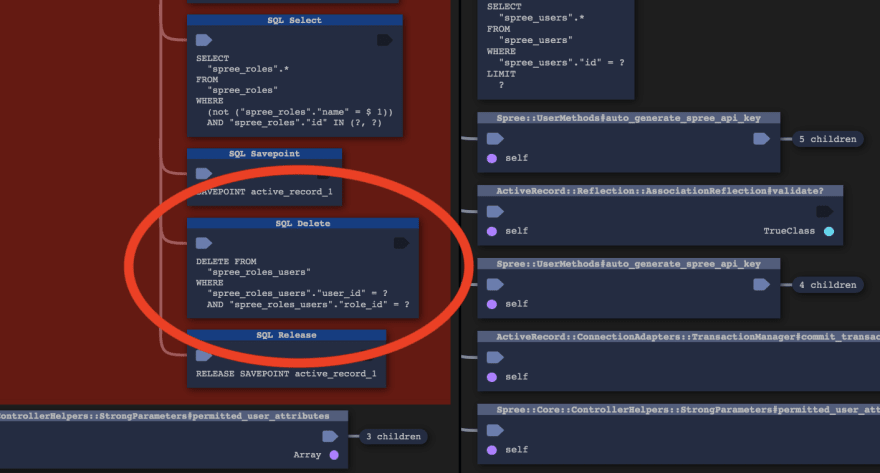
After this experience, we are more careful about allowing complex queries into our code base without a detailed review. Fortunately for us, we have AppMap Diagrams of all of our code, and they show all SQL queries in detail. Therefore, we know exactly what SQL is being introduced in each PR, and we can inspect the query plan before merging each new or modified query. To make it even easier to identify and review SQL changes, we are adding the ability to “diff” the behavior of AppMap (yes, it will be open source). This new feature reports and highlights changes to important code paths, including SQL.
Here’s an example of an AppMap Trace Diff which shows a SQL DELETE statement being removed in a proposed code change (with my emphasis added):

In our code reviews, we highlight any changes to queries that might be expensive. Then, if possible, we check the query plan on the production database before deployment, to catch any surprises before we make them live. We’ve also added better monitoring, both on our app, and on the database. Again, this is pretty basic stuff, but startup teams are busy. Sometimes (a lot of the time…) it’s more important to be refining the product to fit the users’ needs than to be worrying about preventing a maybe-going-to-happen-someday problem. This slow query problem reminded us that it was time to “up our game”, in both monitoring and the care we take with SQL.
Thanks for reading! Follow me to stay updated on the next 4 posts in this series.
AppMap for VSCode provides interactive maps and architecture analysis to help you write better Python, Ruby, and Java code. It takes only 2 ¹/₂ minutes to install, configure, and generate diagrams. Check it out on the VS Code Marketplace!
For a full tour of AppMap and code architecture diff in action, check out our demo at the New York Enterprise Tech Meetup.
Originally posted on Dev.to
