Fixing performance issues is often harder than fixing bugs, because success is harder to define and demonstrate. How fast is fast enough? Are you sure that the fix will work in production, without testing it there? (Because development environments are so different than production environments, and production contains so much more data, bad surprises are common). Since there’s not usually a definitive test case that proves success, your performance changes can be challenging to review.
Back in March, we had an unwelcome performance-related surprise of our own, in which an “optimized” SQL query actually performed much worse in production than we’d expected! So we’ve been working with our Slack community to figure out how to ensure that performance-related changes are robust, and how to avoid “fixes” that are actually regressions.
It really comes down to showing your work, which means recording the real performance and operation of the proposed fix, and making that information easily accessible during the code review process.
What do I mean by “real performance and operation”? When reviewing a performance fix, getting a clear presentation of optimized code behavior is half the battle. The other half is seeing performance numbers, on a realistic data set, that are clearly better than the previous version.
As we discuss the challenges of modern development with our community, in forums like this one, the need for better tools and methods for tackling performance problems has come up over and over. If you aren’t familiar with AppMap, it’s an open source tool that:
- Records code execution at runtime.
- Presents the data in a variety of useful diagrams and analyses.
It’s a useful tool for demonstrating how a performance fix actually works, and it can provide assurance that the fix is going to work as intended without other adverse side effects. With the recent addition of performance timing data, AppMap is well-suited to documenting performance impacting code changes and optimizations.
Of course, having the right tool is just the beginning - you also need the right workflow to use it efficiently. So, we’ve been working with our community to present a helpful workflow, and in this post we’re sharing it more widely. If you’re interested in this problem, please keep reading and respond with your feedback in the comments. AppMap is 100% free and open source, so you can feel at ease trying this out on any code base.
Last week, we demonstrated how you can use AppMap to verify that a performance issue can be replicated locally, identify the root cause and apply a fix. Now let’s discuss how to demonstrate performance fixes in a pull request, so you and your teammates can close tickets faster and more confidently.
When working on performance, it’s essential to use realistic timing data. Don’t guess where the flaw lies! Compare the timing data from before and after the performance fix. In that way you confirm that you’ve really resolved a performance issue. Once your code is written, share the before-and-after data in your pull/merge request. This allows your colleagues to be confident that your changes will work as intended.
Here’s a brief demo that shows how sharing AppMap Data can help accelerate your PR review process (if you prefer to read vs. watch, a written version of the demo follows the video):
-
0:03In part one, I used open source AppMap to quickly address a performance bug in my Python Django application. In this demo, I’ll show how to use the same AppMap Diagram for documenting the bug and my fix for my team so my code can be reviewed, approved and deployed in the shortest time possible. -
To quickly recap the previous demo: from a test, I recorded an AppMap that visually documented a performance bug in my running code. Then I applied a fix, re-recorded the AppMap from my test and confirmed that my fix addressed the root cause.
-
00:41And this is the AppMap of my performance bug before the fix: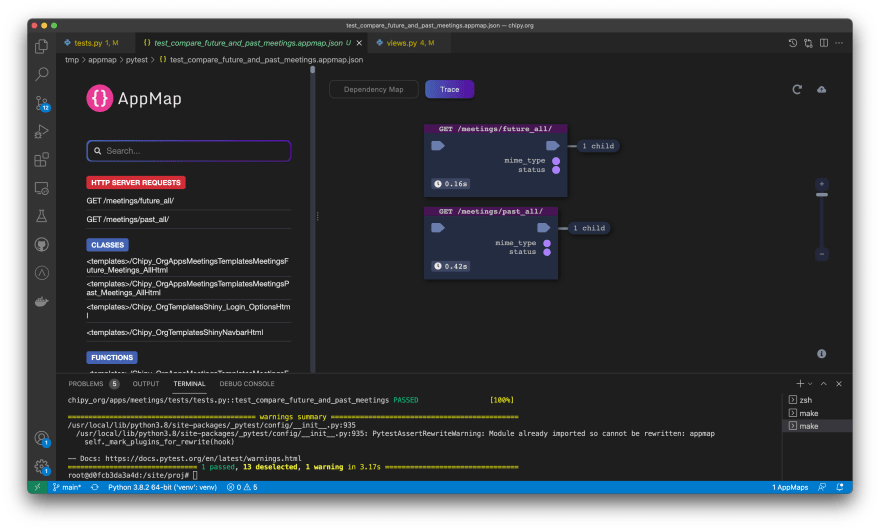
-
It clearly shows that one of my “meetings” endpoints worked as expected, while the other one was suffering from the “N+1” problem (i.e. excessive trips to the database caused by imperfect ORM query definition, executing 1,501 queries vs 3 of the other endpoint).
-
01:00Let me prepend this AppMap’s filename with “before-“ so I can save it for later. -
01:06And here is a new AppMap recorded from the same test after I applied the fix: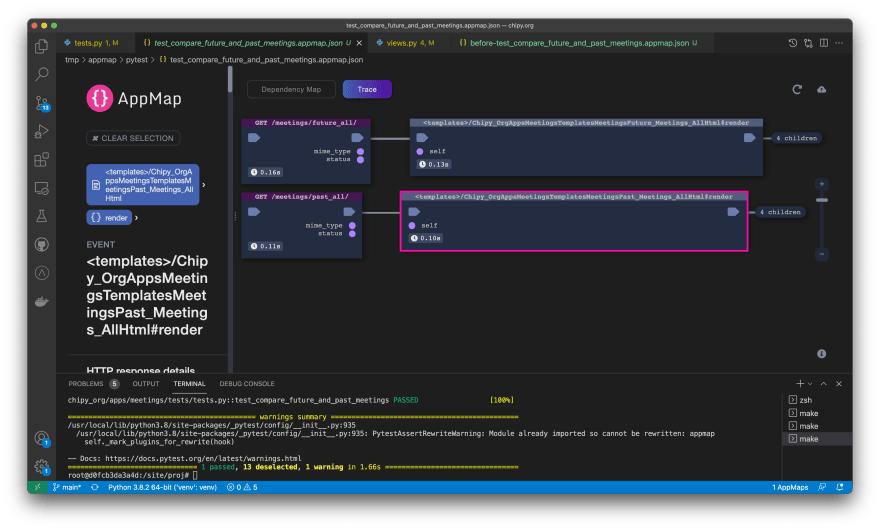
-
As you can see, the second request now also needs only three trips to the database as well, and the time required to execute it shrank to 1/4 of the original.
-
01:23Let me rename this AppMap as well, this time I’ll prepend its name with “after-“. -
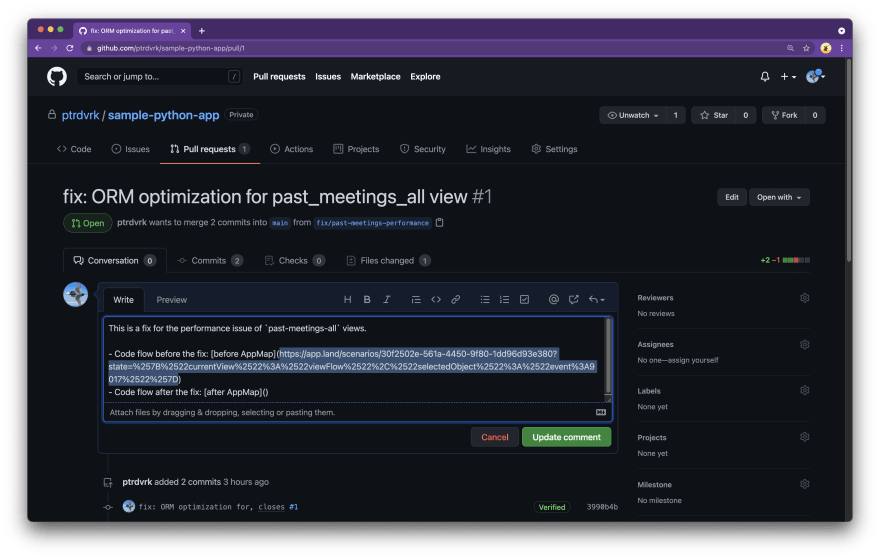
01:30Now I’m ready to create a Pull Request with my fix and submit it for review. And since the AppMap helped me understand the bug and validate the fix, I’m going to attach the before-and-after AppMap Diagram to my PR.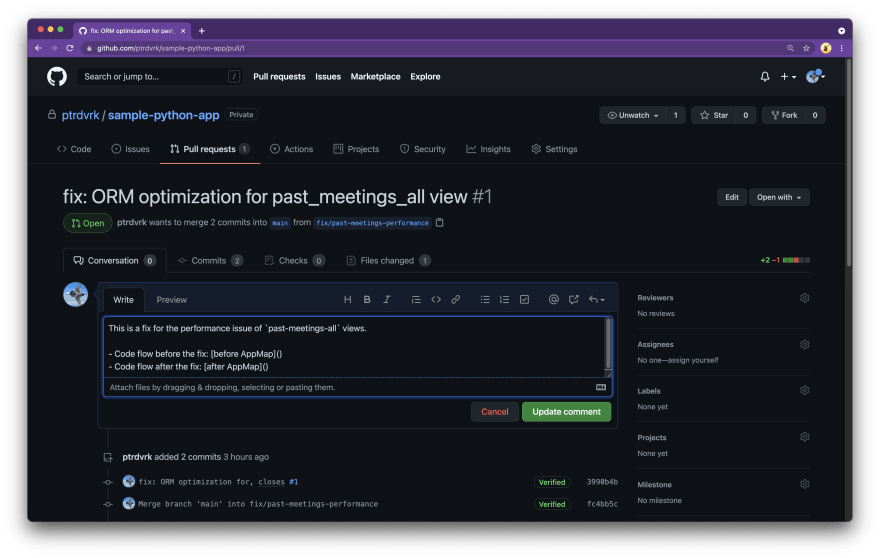
-
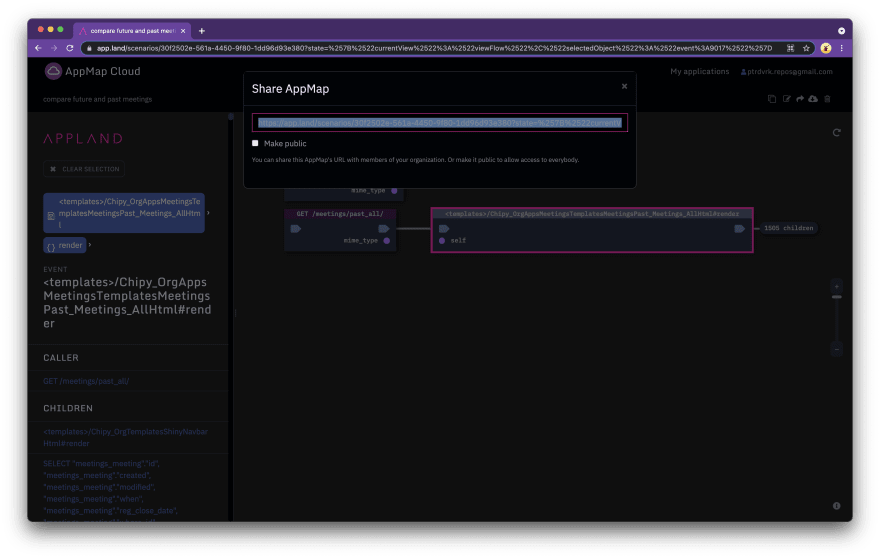
With the before AppMap, I can upload it to the ticket directly or create a Snippet and link it from the request. I can also upload it to our file sharing service and add a link there. But in this demo, I’m going to use simple sharing with AppMap - a cloud repository and interactive viewer that makes collaborating with my teammates fast and convenient.
-
02:08I open the AppMap, click the “Cloud upload” icon and confirm the action. I can activate with my GitLab or GitHub account and my AppMap opens in the cloud. I can now get the sharing link and add it to my Pull request: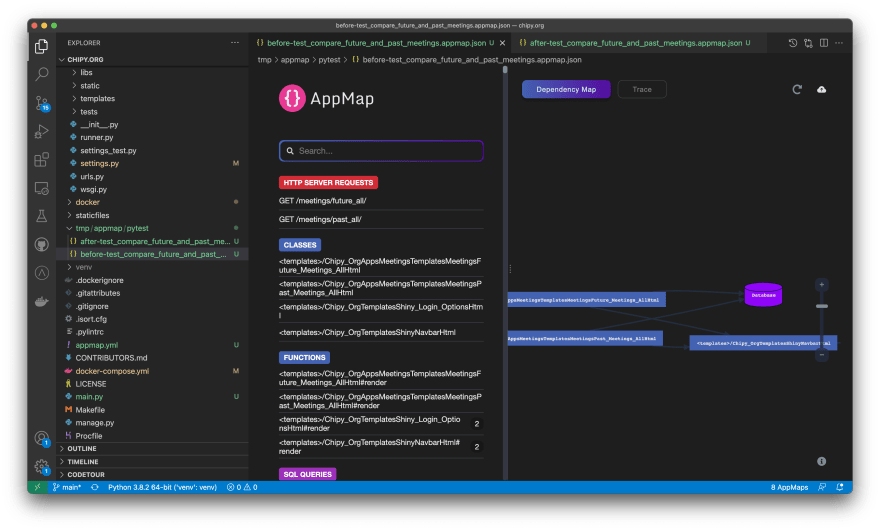
-
02:27Let me repeat the same with the “After the fix” AppMap. Open, upload, share. -
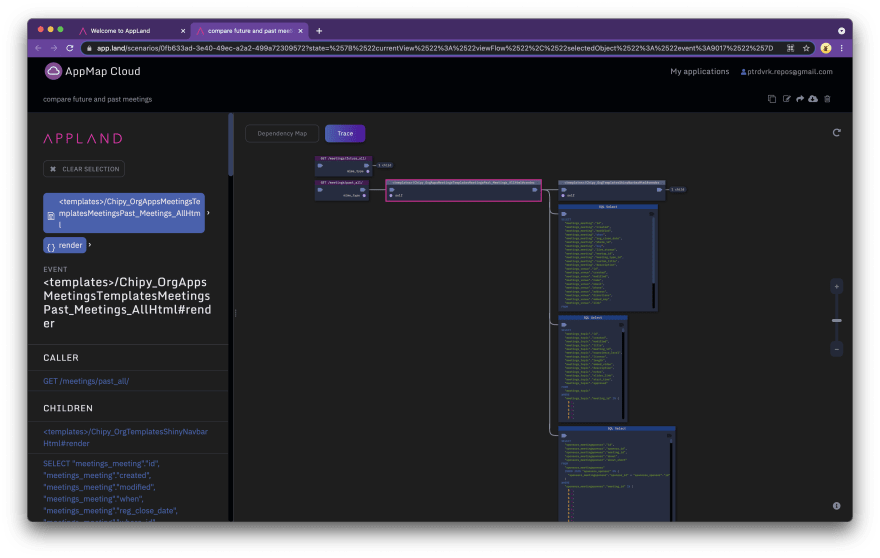
02:40When my teammates open the Merge request, they can instantly open and review my AppMap Diagram and the linked code in their web browser, or they can download the AppMap Diagram and open them in their code editor. With access to my AppMap Data, my teammates can quickly observe the behavior of the impacted code before and after my bug fix, allowing them to review and merge my changes faster and more confidently.
Questions or feedback? We’d love to hear from you – reach out in Slack or Twitter!
Code maps for performance improvements (2 Part Series)
- Quickly find and fix performance problems by combining performance, debug, and execution trace info
- Make performance fixes easy to review by showing the before and after
