Runtime analysis is the latest and greatest way for developers to find, flag, and fix software flaws before production. Our series on rules and their impact is focused in this article on Slow Function Calls, HTTP Requests, and SQL Queries.
I will review what these rules mean and how to enhance your application performance using AppMap.
If you learn better through video you can check out a walkthrough of these rules here:
Slow function calls
In this first example, let’s use AppMap to locate a performance finding related to slow function calls and use the new flame graph view to see the duration of each function call. It’s crucial to optimize those long-running functions, as they can significantly impact performance. Often slow function calls are caused by poor code practices, inadequate algorithms, or excessive resource consumption, leading to scalability issues, bottlenecks in system responsiveness, and even user frustration
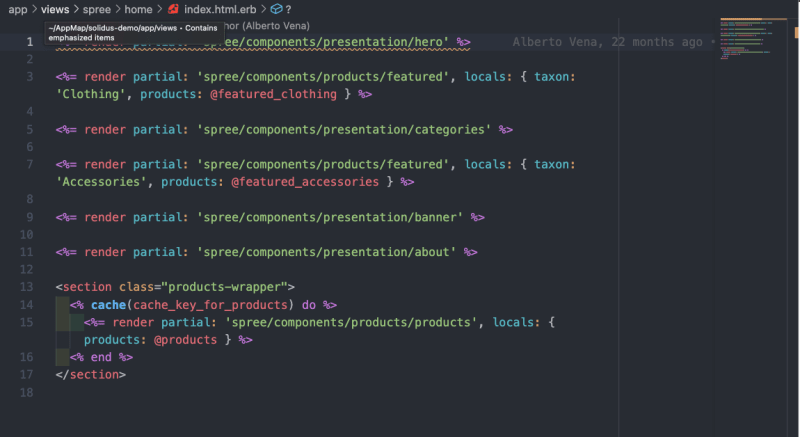
To illustrate this, let’s examine code snippets related to slow renders and highlight the usage of partials. Repeated rendering of partials within loops can significantly impact performance.
For some context, the example we are dissecting today is an e-commerce merch store. To make sure we are all on the same page, the AppMap we are looking at outlines the user interaction of a user selecting featured products to view. The function in question ActionController::Renderers#render_to_body can be plainly seen in the flame graph.

When we dig a little deeper and see what is actually happening.

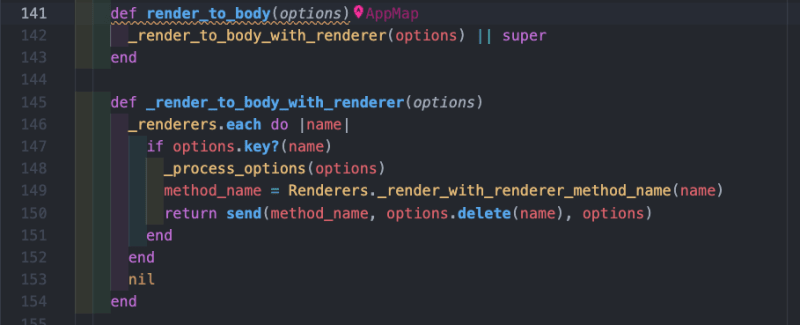
We can see that Render_to_body calls render_to_body_with_renderer which gets passed a series of options. Looking into the function itself we see the _renderers.each do ... which, when passed a file with a lot of partials that need to be rendered, some containing caching operations themselves, we start to understand exactly why this function runs for such a long time.

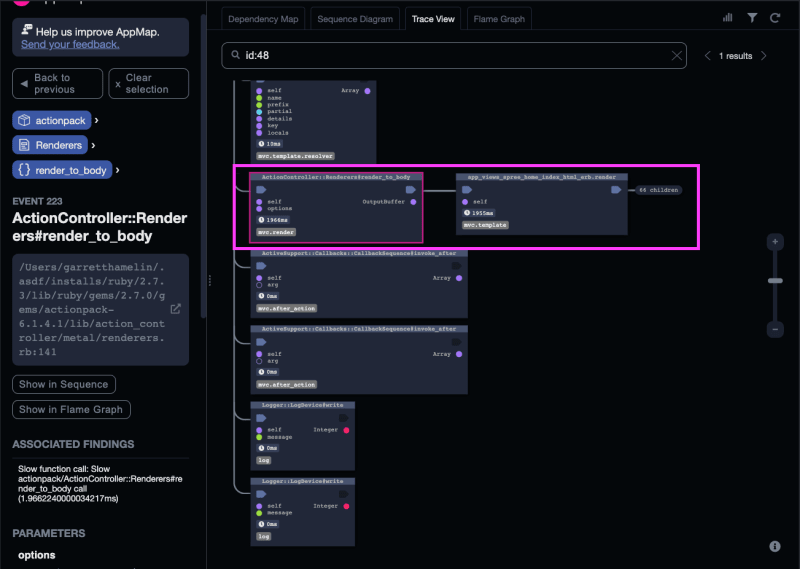
Looking at the trace view, we can see just how many children are spawned and will complete before we can return from the original calling function.

To mitigate this we may want to reduce the number of partials that we are individually working with. Good coding practices encourage abstraction and code reuse but doing so may have introduced a performance concern. We need to be careful that we don’t abstract which can impact the performance of our application at runtime.
Slow HTTP requests and SQL queries
Slow HTTP requests and SQL queries often stem from a range of situations, ranging from suboptimal coding practices, inefficient schemas and configuration, or lack of indexing to lack of resources available, and high network congestion. We need to be aware of potential causes, such as the lack of caching HTTP requests or leveraging a content delivery network (CDN) for faster content delivery.
Find and fix performance issues
To address slow function calls, HTTP requests, and SQL queries, we can implement effective mitigation strategies by updating our coding practices and improving resource management. For slow renders, alternative home or index views can be used to minimize the number of function calls. Additionally, you can leverage caching techniques and pre-render pages that don’t require dynamic data, as well as load-balancing techniques to reduce the pressure on our network.
In summary
To improve application performance, it’s important to identify and optimize slow function calls, HTTP requests, and SQL queries.
AppMap’s flame graphs and other tools like the interactive sequence diagram make it easy to pinpoint performance bottlenecks and implement appropriate mitigation strategies.
Links
- ⬇️ Download AppMap for VSCode and JetBrains
- ⭐ Star AppMap on GitHub
- 🐦 Follow on Twitter
- 💬 Join AppMap Slack
- ℹ️ Read the AppMap docs
- 📺 Watch AppMap Tutorials
- 📸 Cover Photo by Robert Linder on Unsplash
