
Ramping up on an unfamiliar codebase is challenging. Even when the code is “clean”, the initial experience of opening up the code editor with dozens of folders, hundreds or thousands of files, is really daunting. It’s hard to know where to start, it’s hard to know which parts of the code are relevant to your task, and it’s hard to know how all the different pieces fit together. Today, we are introducing the AppMap extension for VSCode, which automatically records and diagrams software behavior by executing test cases. AppMap Diagrams provide a way to walk through automatically generated white-board style diagrams right in your code editor without any effort.

What’s the best way to get started on a new, large code base? This question was asked recently on Twitter. The most popular answer was: go talk to an expert. Experts are undoubtedly helpful! However, experts are busy! They have the knowledge that everyone needs, but they are also the team members who are best suited to take on the most challenging development tasks. In a perfect world, software projects would have detailed code tours for every feature. But there’s no time to build and maintain those… What if the code could create its OWN tour, automatically, for any desired feature?
In a previous post, AppMap: A framework for monitoring end-to-end code and data flows, we described an open data format that captures detailed information of runtime code execution, data snapshots and application metadata. Now I’d like to expand on that framework to describe how test cases are of the best, yet most underutilized, resources for learning a code base. In particular, the system and integration tests that exercise the code from end-to-end. The AppMap extension for VSCode can turn any test case into an end-to-end code tour, which is perfect for learning about the code base within the context of a specific task.
How does it work?
The AppMap framework can record the code behavior of any test case, and save it as a JSON file called an AppMap. The AppMap framework also includes free and open source diagram tools that you can use to visualize and explore AppMap Data.
Here’s how you can use AppMap Diagrams to get a detailed, visual code tour:
- Choose a test case which is relevant to the flow that you want to learn about. A mentor or experienced developer on the project can point you to one, if you aren’t sure which one to use.
- Run the test case to generate an AppMap
- Open the AppMap in VSCode
You’ll get:
- A dependency map diagram which is auto-generated and consists of all the packages, classes and dependencies that are utilized by the test case.
- A detailed code trace, showing variable values, HTTP client and server requests, SQL queries, and more.
- Integrated links to source code throughout.
How do I use it?
Let’s take a detailed look at how it works in practice.
The first step is to install and configure AppMap for your project. We’ll assume this has been done for you already. If not, you can find the language client for your project along with setup instructions on GitHub:
Next, locate a test case that will help you build your understanding. As we discussed earlier, asking a local expert can be a good way to get this information.
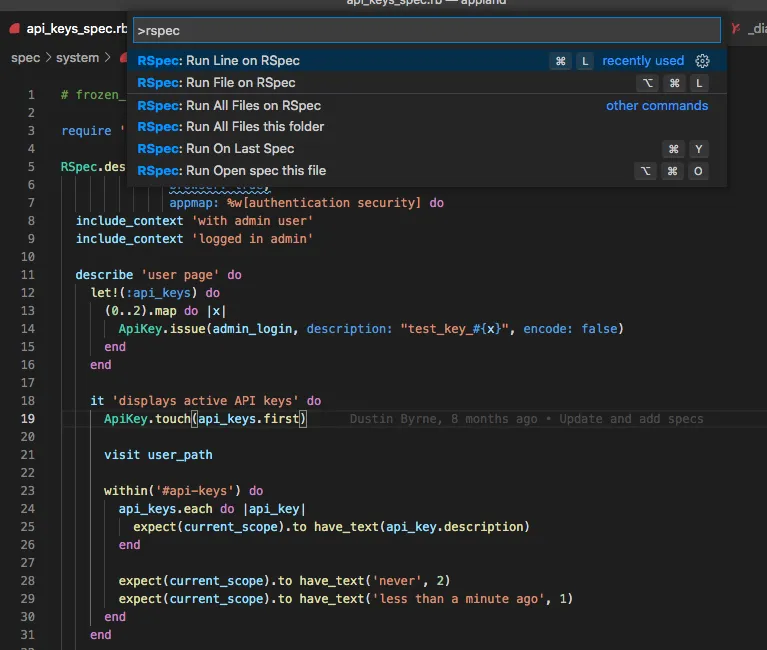
In your development sandbox, pop open the test case file in Visual Studio Code. Run the test with AppMap enabled. You can do this from the command line using the environment variable APPMAP=true (set APPMAP=true on Windows), or you can configure an extension like Test Explorer UI or Run RSpec File to run the test case using a Visual Studio Code command. Launching the test case will look something like this:
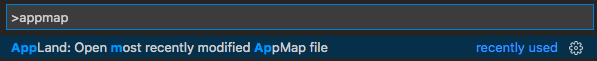
Now you can open the generated AppMap in the visual display which is provided by the AppMap VSCode extension, using the command “AppMap: Open most recently modified AppMap file”.
And… voila! You’ve got an interactive diagram of the end-to-end code paths used by the test case.
Working with the AppMap view in Visual Studio Code
Let’s take a closer look at the AppMap interface and how it works.
Details
The “Details” panel on the left hand side will be used when you click on something, such as a package or class.
Filters
“Filters” is used to type in the name of a particular object, such as a class, and focus the diagrams on that class. When you are brand new to the code base, you may not have any particular class names in mind, but as you use this tool in the future, perhaps to troubleshoot a bug, you may have a better idea of exactly what you want to look at, and Filters can help with that.
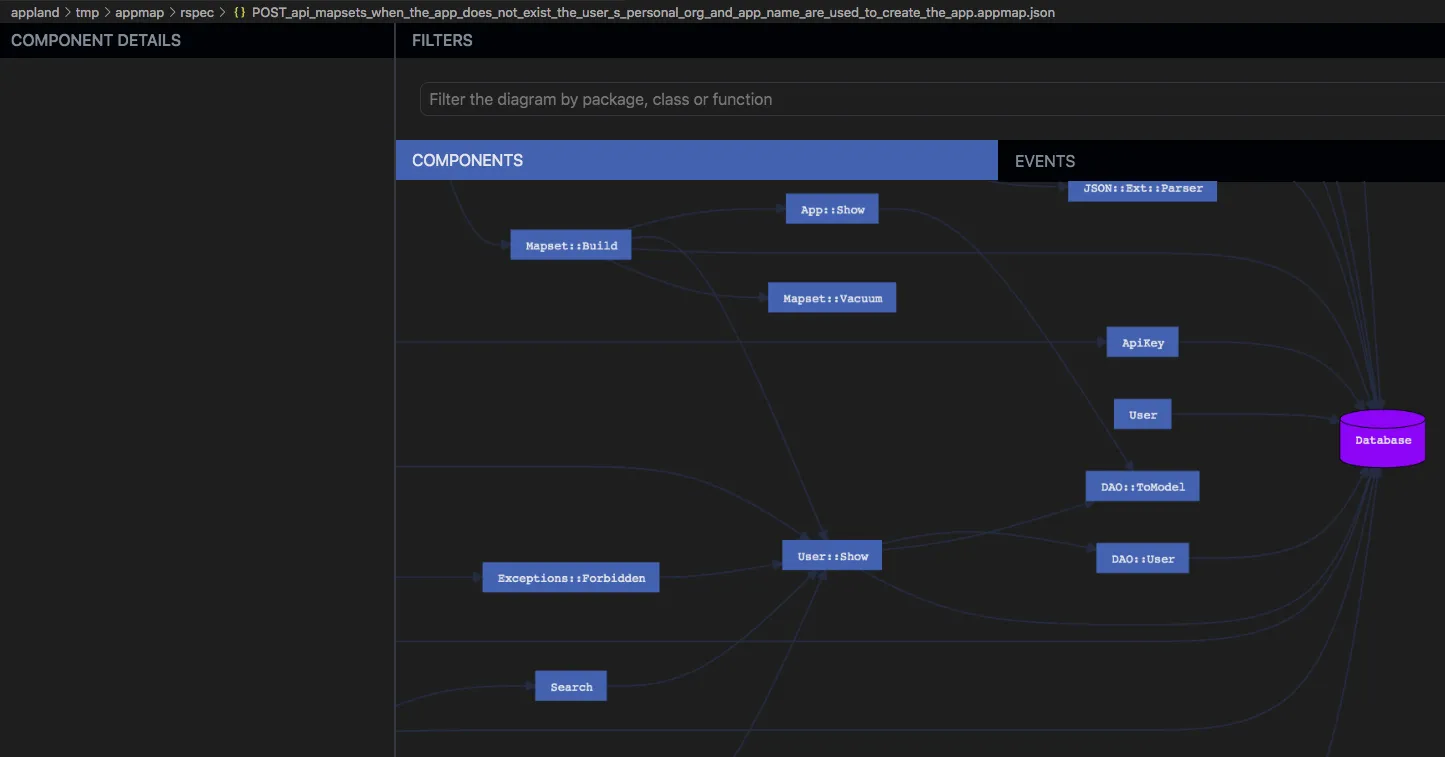
Components
This is a view of the code, grouped into classes and packages, that was actually executed by the test case. When a class calls another class, the result is a link (edge) connecting them, with an arrow denoting the call direction. Keep in mind, this data isn’t coming just from a static analysis of the dependencies in the code (e.g. import and require statements). It’s coming from the actual execution trace through the code base.
SQL queries are denoted by the database icon. You can get specific details about SQL by switching to the Events view.
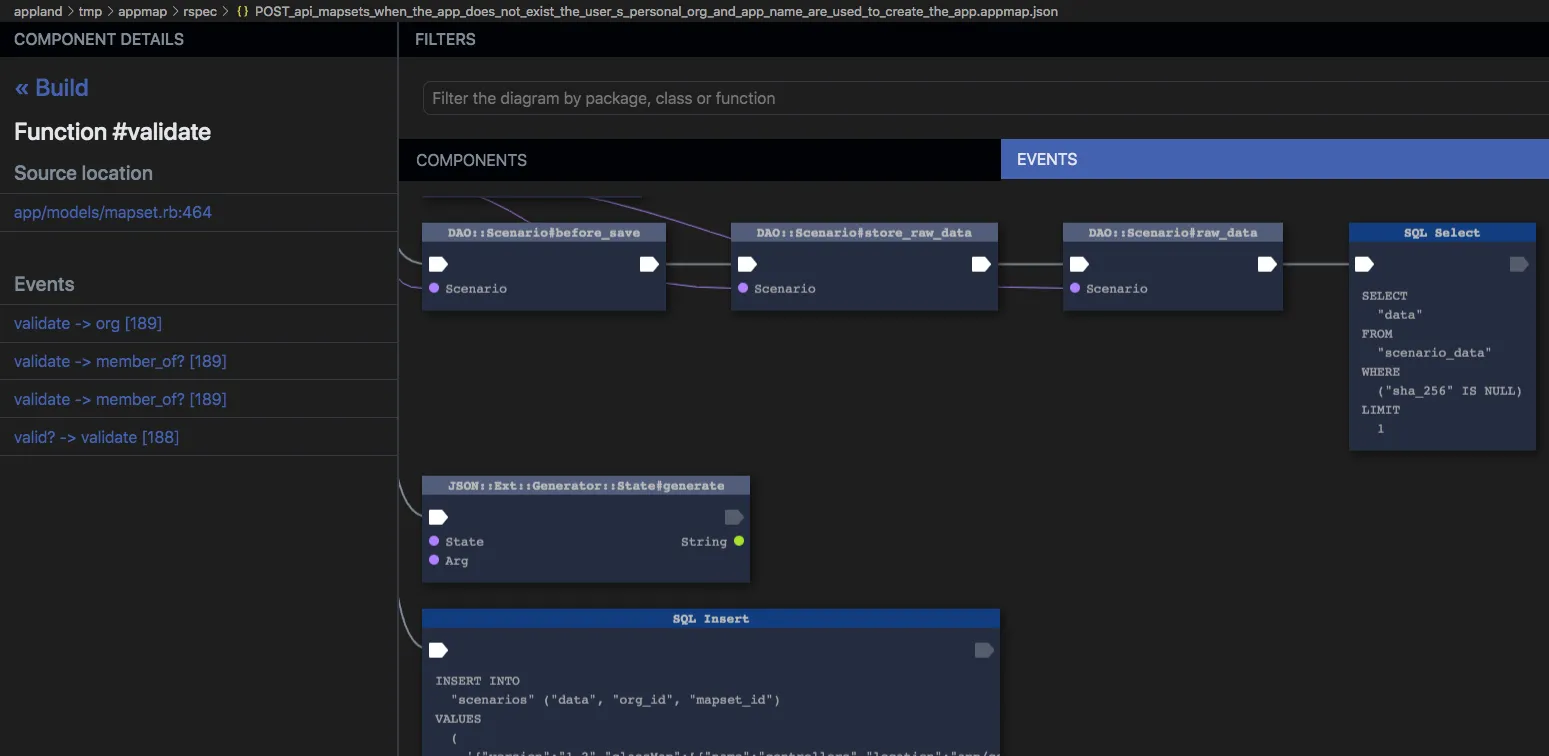
Events
Click on a class in the Components view, then choose one of the functions, then choose an Event in which that function is used:
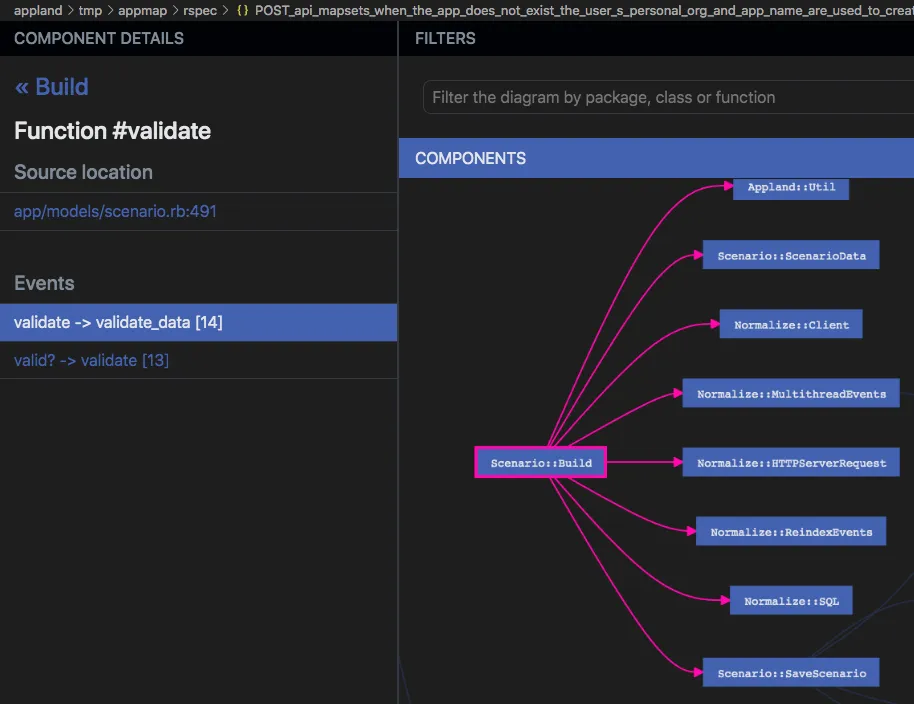
Clicking on the event will open the Events view.
Each node (box) in the Events view represents a specific HTTP server request, function call, or SQL query which occurred in the test case. You can think of it like having the data from a debugger, but you can jump to any location in the call graph. The Events view flows from left to right and top to bottom as the program moves forward in time.
Interacting with the diagrams
The diagrams are fully interactive; they aren’t static pictures like UML. You can:
- Expand and collapse packages.
- Click on classes to view detailed information about that class.
- List the functions of a class which are used by the test case.
- Explore callers and callees.
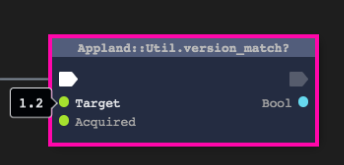
- View variable names and values at any point in the code flow, clicking on a variable in the Events view
- View SQL queries.
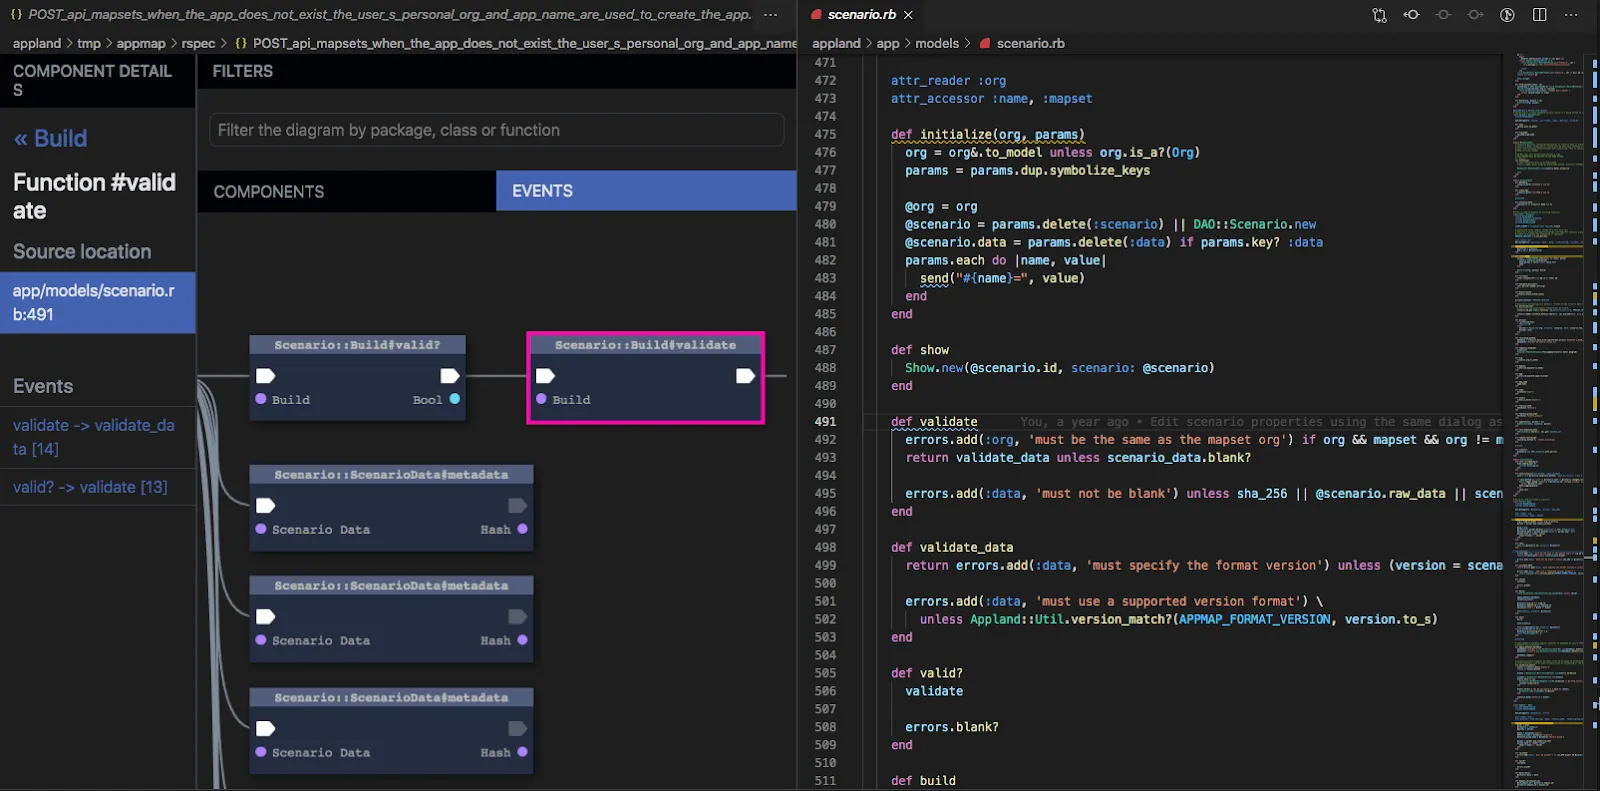
- Open source code right to the line of any particular function, by clicking on “Source location”
Wrapping up
We hope you’ll agree that the ability to navigate through code through the lens of an actual usage scenario is really powerful! You can instantly see how the code is connected, and switch between high-level views and low-level details.
Thanks for checking out AppMap. We look forward to hearing your thoughts and feedback.
Join us on Twitter and in Slack.
The AppMap team