AppMap helps you understand new to you code, debug issues such as slow performance or security flaws.
AppMap records code execution traces, collecting information about how your code works and what it does at runtime. AppMap shows this information as interactive diagrams that you can search and navigate.
You can see how functions, web APIs, databases, security, I/O, and other services all work together when your application runs. AppMap is an extension to your code editor, so its information is always available when and where you code. Whether you are documenting your internal APIs or reverse engineering an old application, AppMap has the information you need to keep moving forward.
AppMap Diagrams: Recordings of Runtime Behavior
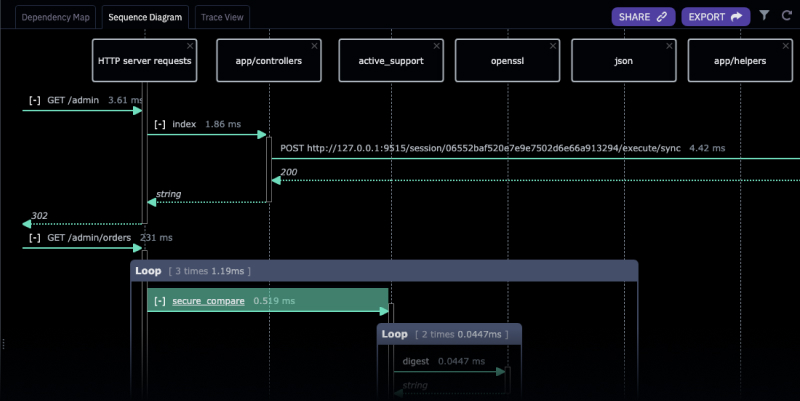
AppMap Diagrams are files containing data representing the runtime behavior of an application. AppMap files can be displayed as visual maps and sequence diagrams, showing everything that the application did at runtime while AppMap was recording.
AppMap records all the HTTP requests, function calls, SQL database queries, and other important events that occurred while the application runs.
Best of all- these files stay with you, in your own code editor environment so you don’t need to worry about third-party security issues.
Visualize and Understand Application Behavior
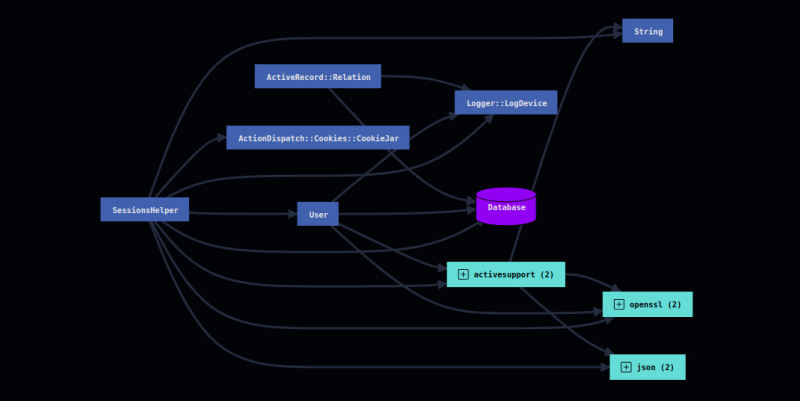
AppMap Diagrams can be analyzed and searched to follow execution traces, locate dependencies, debug behavior, and much more. Developers being onboarded to a new code base can use AppMap Data to navigate the application in a visual way.
AppMap drastically reduced the amount of developer toil required to learn a new code base and become productive.
Automatically Scan for Runtime Problems
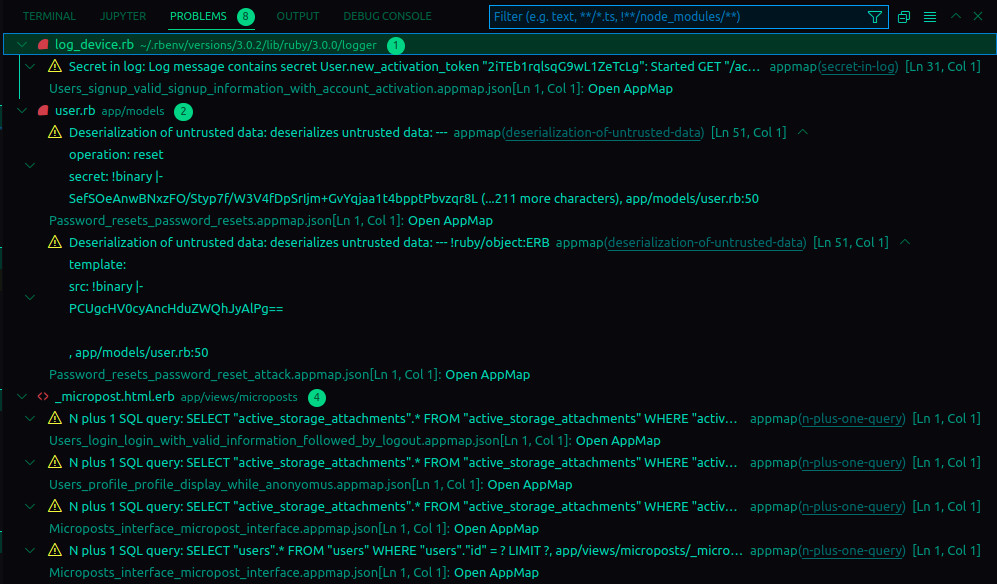
Once AppMap Data is generated, AppMap Analysis will immediately scan those recordings for flaws. AppMap Analysis can find security gaps, performance issues, problematic database queries, reliability issues, and more.
Unlike traditional tools, scans are almost instantaneous. Better yet, where other technologies would only identify that a security issue exists somewhere, AppMap Analysis will also show you exactly where your flaws are located, right in your code editor.

Record Runtime Data Automatically
AppMap offers pre-built recording agents written in Java, JavaScript, TypeScript, Python, and Ruby and works with Spring, Jest, Mocha, Next.js, Express.js, Django, and Rails out of the box.

Available in Your Code Editor
Our editor plugins provide a highly integrated experience for AppMap Diagrams in Visual Studio Code and JetBrains code editors.