A tutorial for process recording for Java with AppMap.
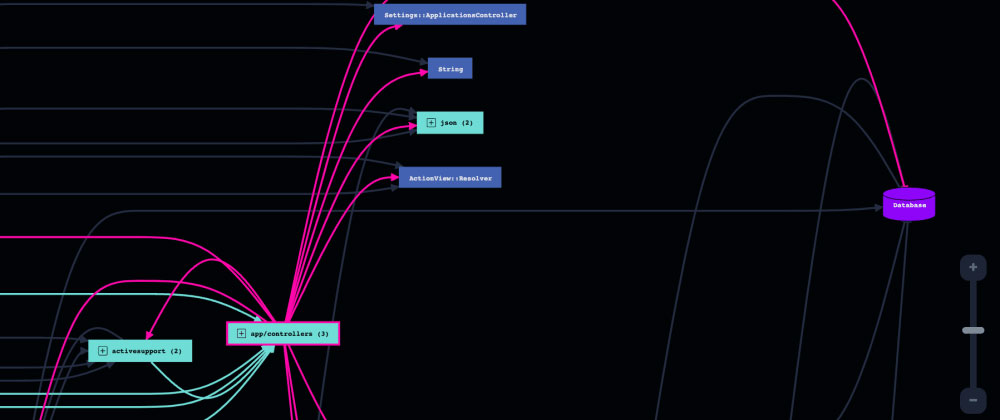
Once you’ve recorded a process, AppMap allows you to get a bird’s eye view of everything going on in a process from start to finish by drilling down into the individual functions and classes. This allows you to understand how data flows through the whole process.
This article teaches how to set up process recording in Java with AppMap. We will use IntelliJ IDEA and a pet clinic application as the example repo.
First, let’s configure.
To do this, we’re going to take a look at run configurations. Run configurations are a convenient way to run your application using different environments with different environment variables. In addition, run configurations allow you to set up multiple scenarios or situations your app could run in.
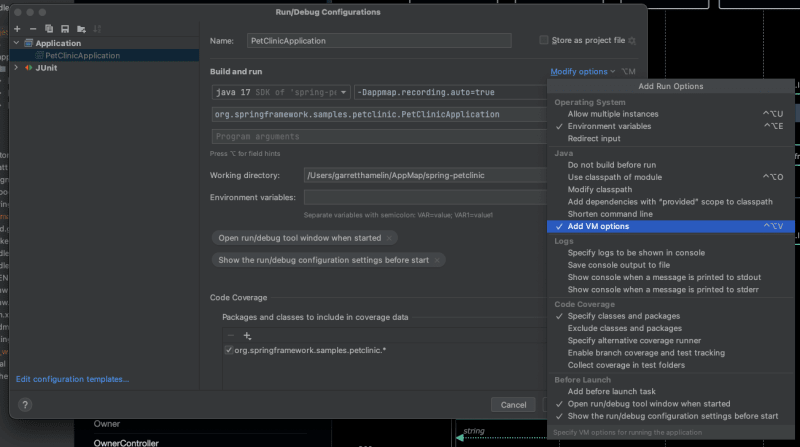
Edit your run configuration by adding a specific variable to the virtual machine environment. To do that, click on the drop-down in the upper right corner of your editor and select edit configurations.
- Edit your run configuration by adding a specific variable to the virtual machine environment.

- To do that, click on the drop-down in the upper right corner of your editor and select edit configurations.
- From here, you should see a field labeled “VM options” under the “build and run” section. The field may be hidden by default, so if you don’t see it, select modify options, then under Java, select add “VM options.”

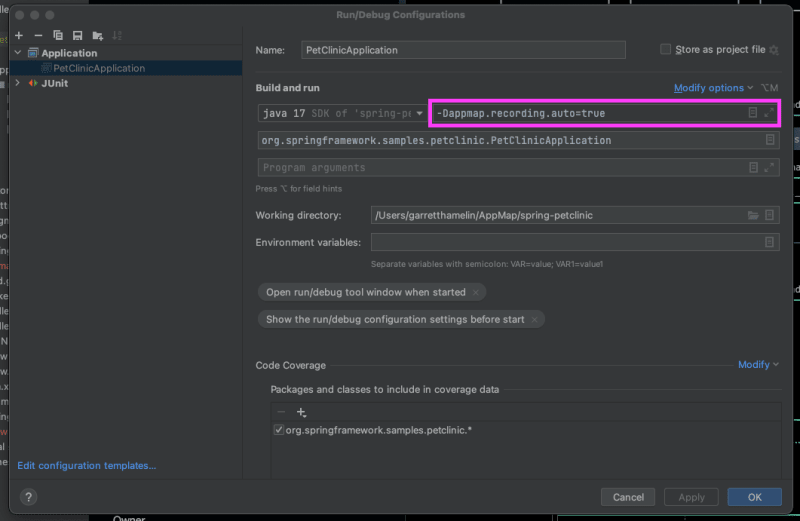
- A new field should appear labeled “VM Options,” inside of which we are going to place this option:
-Dappmap.recording.auto=true
Next, let’s start a recording.
- Select the run configuration you created, and click the “Start with AppMap” button.
- Once the application is running, AppMap will record the process.
It is not readily apparent, but there is a process recording running. You can verify that by looking at the bottom left-hand corner next to the AppMap logo. You should see a green dot indicating that a recording is active.

Finally, interact with your application
- Visit the application running in your browser and use it as you normally would.
- Once you have interacted with your application, press the “Stop” button to end the process.

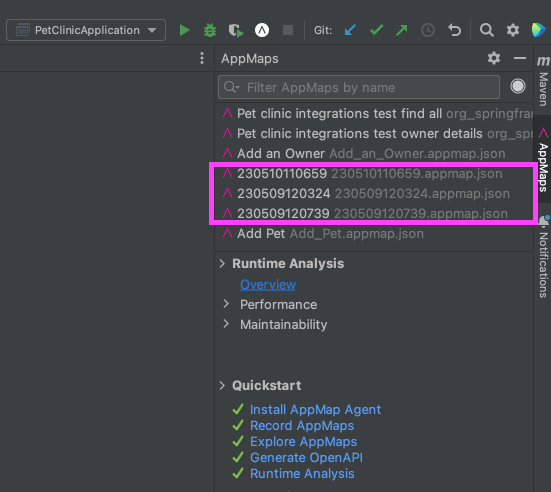
The AppMap recording will stop as well. Soon you will see a new recording designated by a number in your list of AppMap Diagrams, it will be named by the date.

How to use your maps
View your maps, and use them to navigate to code and make changes. You may find behavioral and performance issues by opening the runtime analysis option. Use sequence diagrams, or generate OpenAPI documentation based on this new flow.
Process recording can be done with Python, Javascript, and Ruby as well. Find AppMap in the VS Code marketplace as well as JetBrains.
