
Source code tells you what software could do. Runtime behavior tells you what it actually does.
AppMap runs in development and CI. It records traces from tests, requests, and running processes. Coding agents query them directly, and developers inspect them as maps.
Every detail of the paths that matter
An AppMap trace records the calls, SQL queries, HTTP traffic, exceptions, and code paths from a run. Each recorded run adds another trace to the local set. The goal is not to record everything. It is to capture the behavior the application depends on, in full detail.
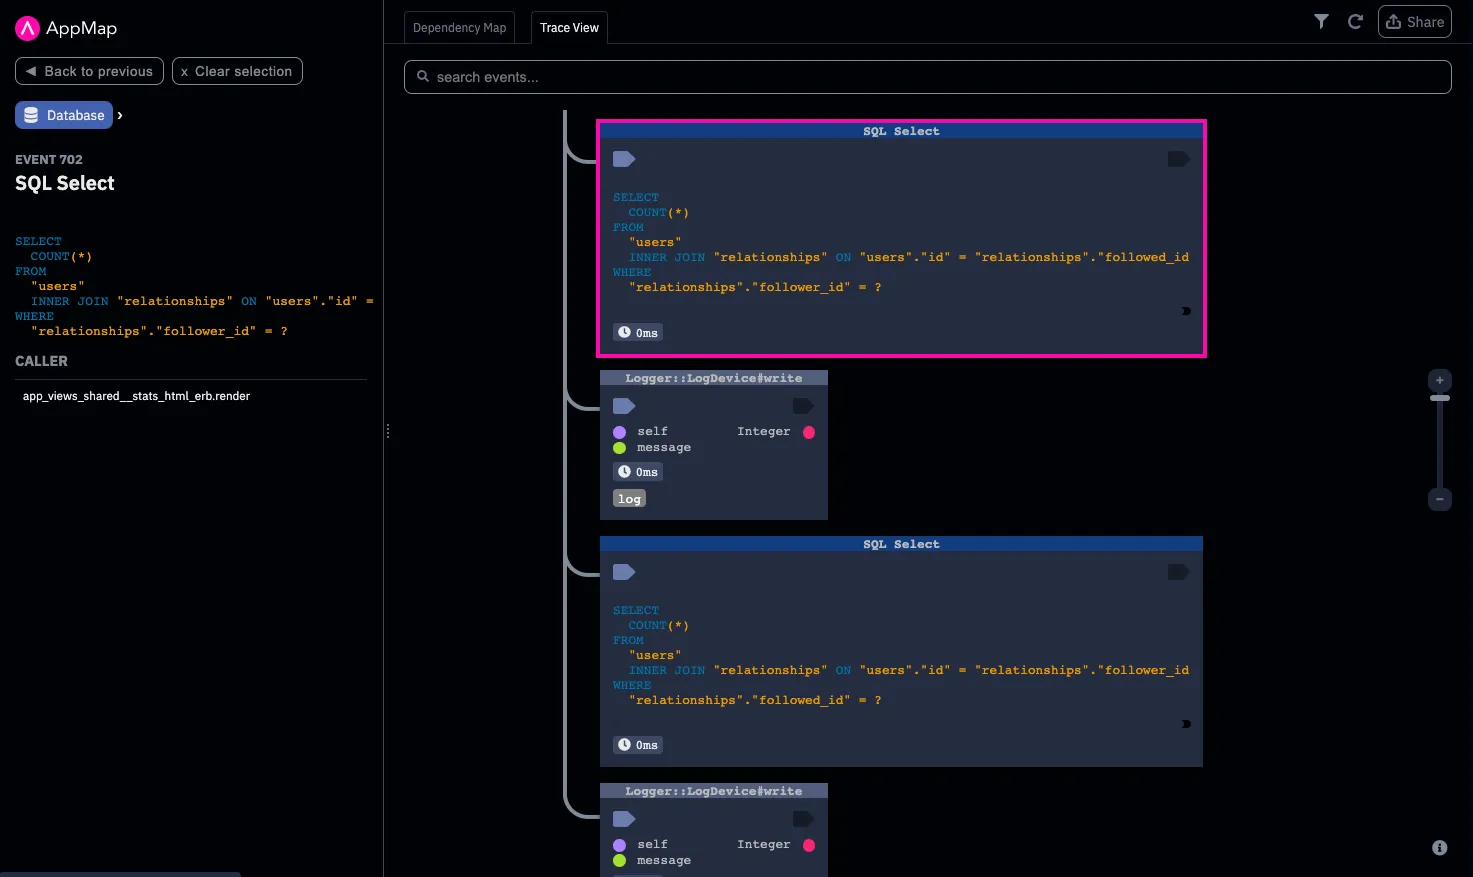
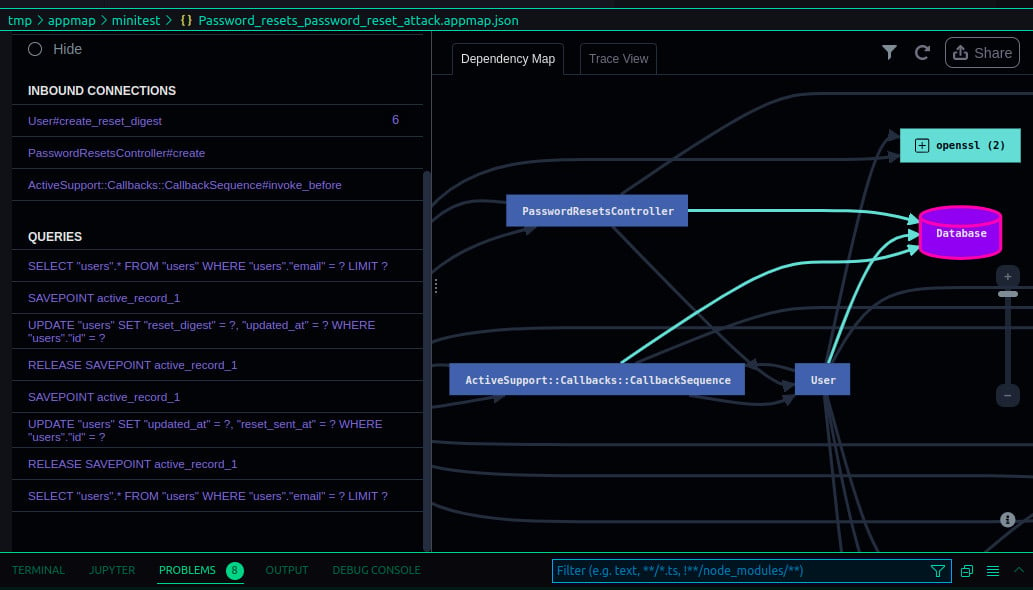
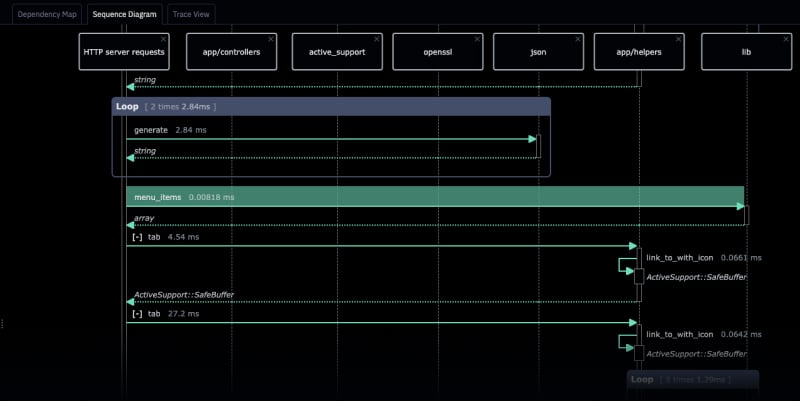
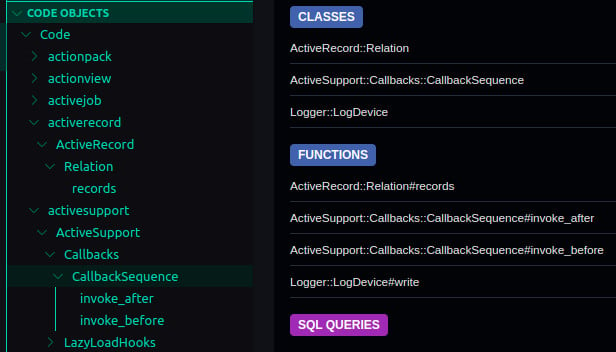
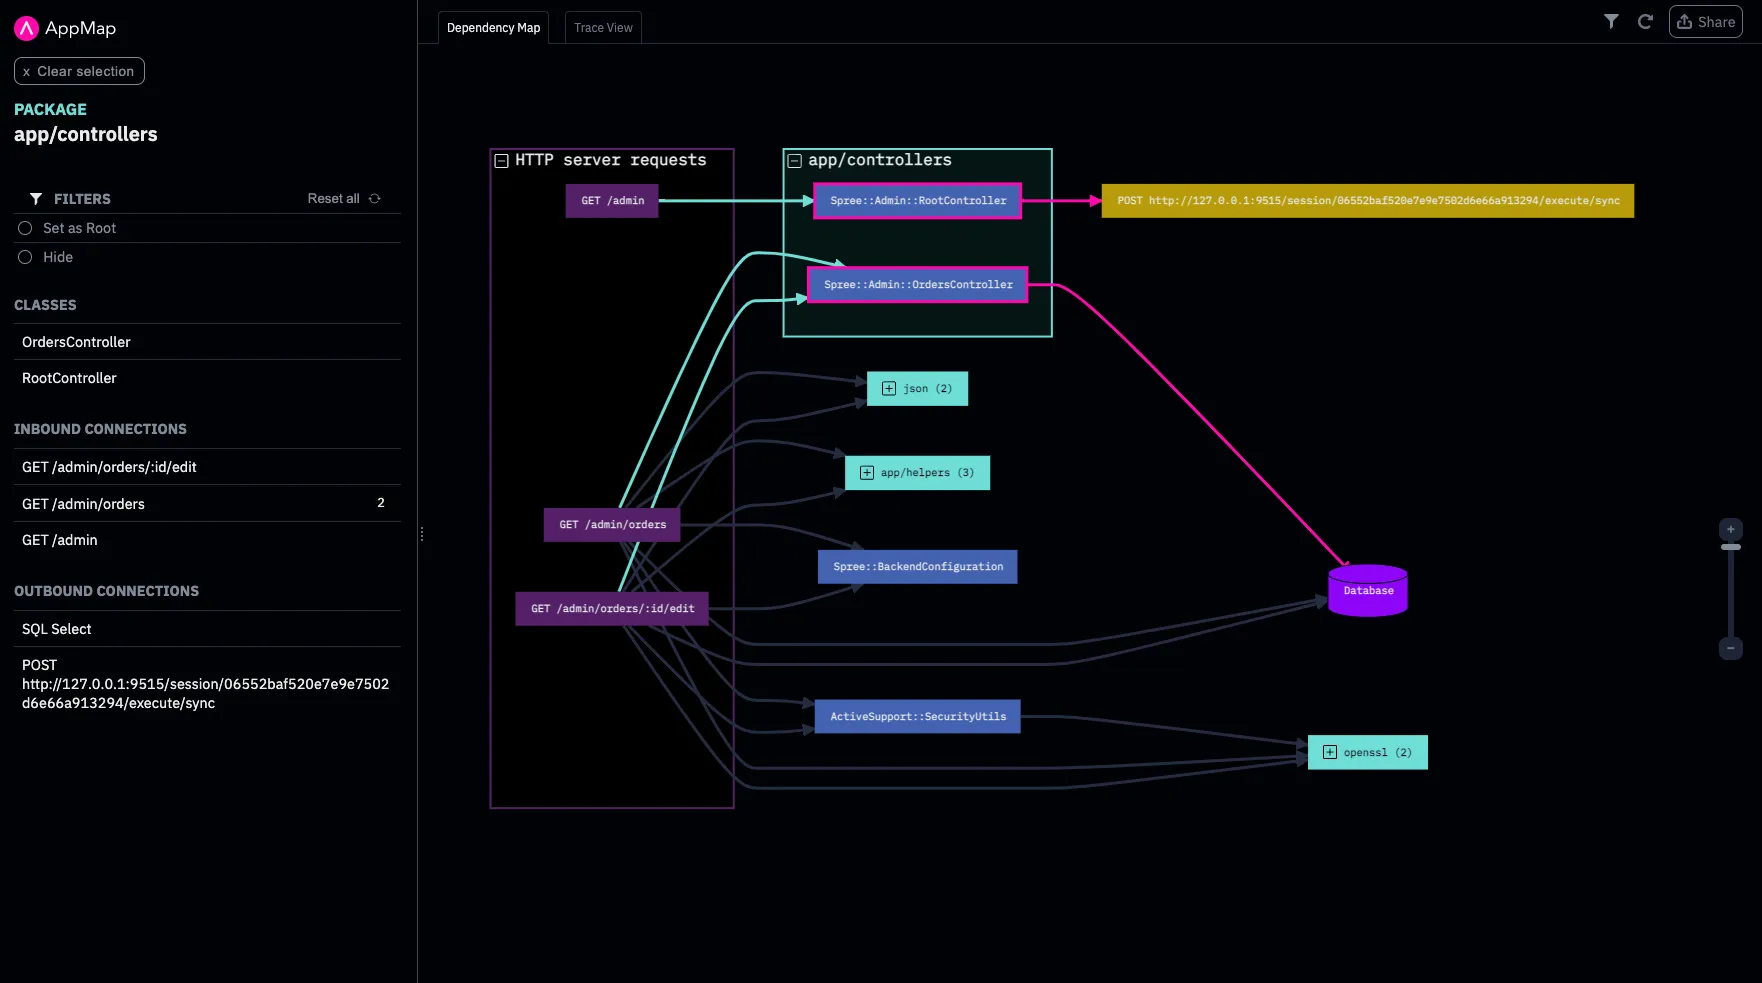
AppMap suggests recording paths your tests are missing.
The Gold Traces skill analyzes the codebase and existing tests to identify the paths that matter. When an important path is already covered, AppMap records it. When coverage is missing, AppMap suggests a focused test case and the coding agent can create it. AppMap then records the path and adds the trace to the Gold Trace set.
The password reset that has no test
A password reset touches the user table, token generation, and email delivery. The happy path has a test. The expired-token path does not. The Gold Traces skill identifies the expired-token path as important and uncovered and suggests the test case. The coding agent writes the test. AppMap records the run, and the expired-token behavior joins the set.
A real AppMap trace of this flow.
Ground truth behavior, versioned with the code
Gold Traces are the team's shared record of how the application behaves. The set lives in the repository, so developers, coding agents, and CI all read from the same place.
When AppMap compares a change against the set, everyone judges the change against the same behavior.
Record locally. Commit the key traces. Query over MCP. Compare at review. The baseline advances after the merge.
How the traces reach your agent
Coding agents read the traces alongside the source, and answer from what the code did. AppMap exposes the recorded calls, queries, and requests through MCP, so the agent can change without changing the runtime context. The model can change too: hosted, self-hosted, frontier, and compact models all read the same traces.
tmp/appmapgold_traces/Everything here runs in the developer environment. The coding agent queries over MCP locally, and AppMap answers from the working traces and the Gold Traces in the repository checkout. AppMap sends nothing off the machine. The traces carry runtime facts an agent cannot infer from source, current at the commit it checked out. They are also the baseline the change is verified against, evidence the agent did not create.
MCP tools: get_call_tree, find_calls, find_queries, find_requests. Details in Docs.
The agent can change. The evidence does not have to.
AppMap records Java, Kotlin, Python, Ruby, and Node.js (TypeScript and JavaScript). In alpha: .NET, React, Swift, and Go.
Looking for support for your language or stack? New languages appear first on our GitHub.
Every pull request explains its behavior and impact.
A pull request should show more than what code changed. AppMap adds visual runtime evidence and a behavioral write-up: what ran, what changed, and whether the change behaved as intended.
A real review, from a production application maintained mostly by AI agents
Two code paths wrote the same record. Each was correct alone. Every test passed.
The handler now locks the row before the ownership check. The recorded SQL confirms it: the read is now SELECT … FOR UPDATE.
1 trace changed by the fix. The other 39 stayed byte-identical.
A review posted to a pull request. Same card as on the homepage, from the same production application.
Changes as intended
For an N+1 fix, a new timeout, a circuit breaker, or added audit logging, behavior should change in a specific way. If the trace does not change, the fix is not there.
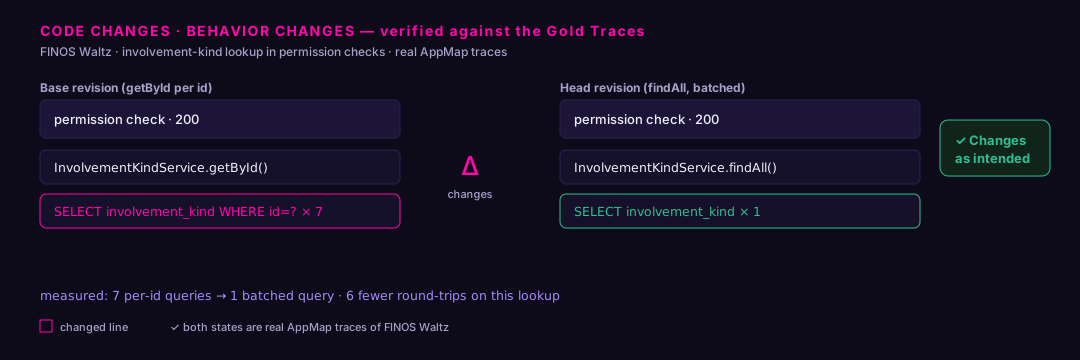
Real AppMap trace · FINOS Waltz
Frequently asked questions
›What does AppMap do?
AppMap helps developers and coding agents understand what software actually does at runtime. It records the application in the editor and turns that run into diagrams you can review and a trace your coding agent can query over MCP.
›How does AppMap help review AI-generated code?
AppMap records the change as it runs and shows the call tree, queries, and data behind it. You review the behavior, not just the diff, and the same evidence travels with the pull request.
›What does an AppMap trace contain?
It is a record of how your application actually ran: function calls, SQL queries, HTTP traffic, exceptions, and the relationships between them. Every map, view, and review is drawn from those traces. AppMap records traces from tests, application requests, or running processes in development and QA.
Read: How AppMap data is made →›How does AppMap work with MCP?
AppMap exposes the traces over the Model Context Protocol. Coding agents call get_call_tree, find_calls, find_queries, and find_requests over the AppMap MCP server to read the same evidence you see in your editor.
Read: AppMap MCP reference →›Does AppMap replace Cursor, Copilot, Claude Code, or Windsurf?
No. AppMap works alongside the coding agent you already use. Any MCP-capable client can read AppMap traces, regardless of the underlying model.
›Does AppMap send code or runtime data to the cloud?
AppMap does not send traces to an AppMap-operated cloud. AppMap records, sanitizes, and compares traces in your developer environment or CI, and working traces stay in the developer environment. AppMap's skills and your coding agent build and maintain the Gold Trace set. Gold Traces can be used locally during development. When a team versions the Gold Trace set with the code, it is stored in the repository and follows the team's existing Git workflow. Gold Traces are sanitized before they are committed. If the developer uses a hosted coding agent, some context goes to that provider. The provider's configuration and terms apply.
Read: AppMap security →›Where does AppMap store runtime behavior?
Traces are captured locally, typically to a tmp/appmap directory in the project. Gold Traces can be used locally during development. When a team versions the Gold Trace set with the code, it is stored in the repository and follows the team's existing Git workflow. Gold Traces are sanitized before they are committed.
Read: AppMap client CLI reference →›What are AppMap Gold Traces?
Gold Traces are the recorded runtime behaviors a team has approved, committed to the repository in a gold_traces/ directory. They give coding agents and developers recorded runtime behavior they could not otherwise obtain, current at every commit, on every branch, and usable as the baseline every change is verified against.
Read: AppMap Gold Traces →›What issues does the behavioral review find?
Not issues from a list. A linter carries a catalog of known-bad patterns and finds instances of them. A behavioral review compares the change against the recorded behavior the team has approved and reports what departed from it. It finds the defects specific to your application, produced by parts that are each correct alone. A catalog of known-bad patterns finds what everyone's code gets wrong. A baseline of known-good behavior finds what your change got wrong.
Read: What the review finds →