Code Investigation
and Debugging

AppMap can help you understand your application's behavior faster than you can possibly do with traditional methods like reading code or viewing stack traces. And when you have an issue to debug, AppMap will be your personal observability tool.

Follow request flows

Follow Request Flows

AppMap's Sequence Diagram view allows you to see the events that occurred in your application while AppMap was recording. Events are shown in chronological order within an interactive sequence view that allows for easy navigating. AppMap Sequence Diagrams can be exported as SVG images for easy sharing with team members, adding to documentation, or for using in Pull Requests.

The Trace View gives even deeper information about application behavior, allowing you to follow requests all the way through to your database and back. You'll see the values of function parameters, call timings, and any SQL queries that were run on your databases.

Examine runtime dependencies

Examine Runtime Dependencies

AppMap can visually represent all actually-used dependencies within an application. For example, if your Ruby application uses Rails, OpenSSL, and a PostgreSQL database, you will see each of those dependencies in the Dependency View.

Importantly, only dependencies that are used by your application at runtime are shown by AppMap. This allows you to determine if, for example, a 3rd-party library with a known vulnerability is truly used by your application.

Inspect Database Queries

AppMap makes it simple to see how your application interacts with SQL databases. You can quickly discover query inefficiencies and anti-patterns that pose hidden scalability and reliability risks even if your application seems to be working well.

With AppMap, not only are trips to database logs no longer required to see the SQL commands, but the commands are also directly linked to the code that initiates their execution, helping you understand the impact of code changes on database operations and performance

View Your Application's
Code Objects

AppMap automatically indexes your application's code objects (functions, APIs, DB queries) and presents them in an easily browsable and searchable catalog, right in your code editor.

Whether you're learning a new code base or trying to debug a production issue, having all the important parts of your application's runtime behavior available at your fingertips dramatically reduces engineering toil.

See What's Important,
Not The Internals

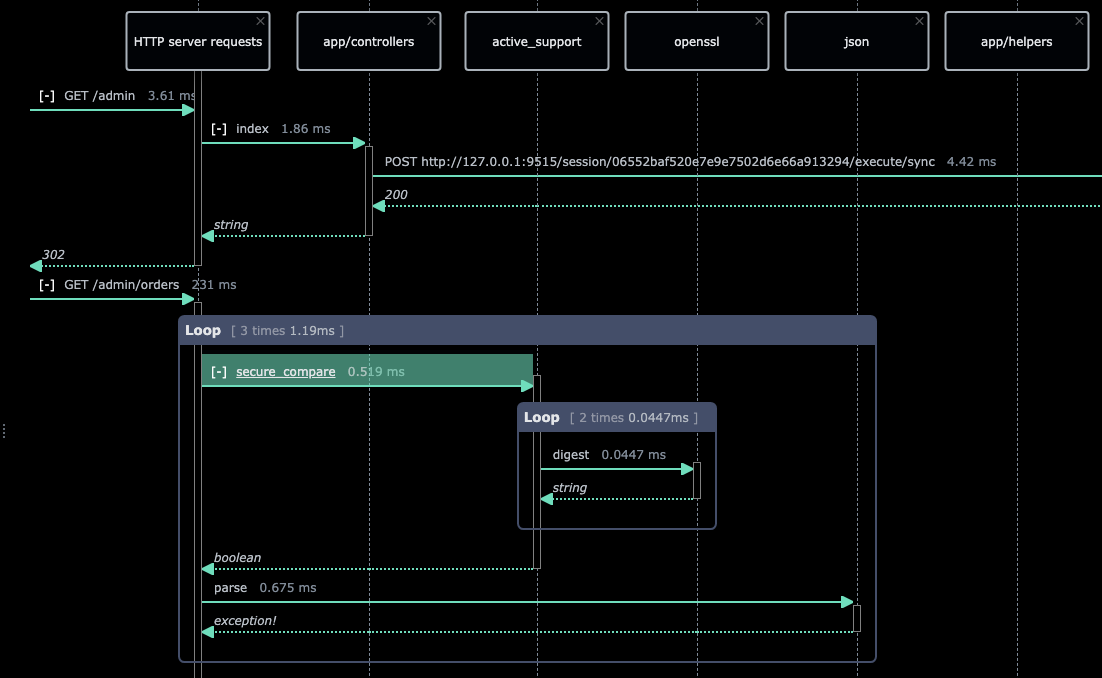
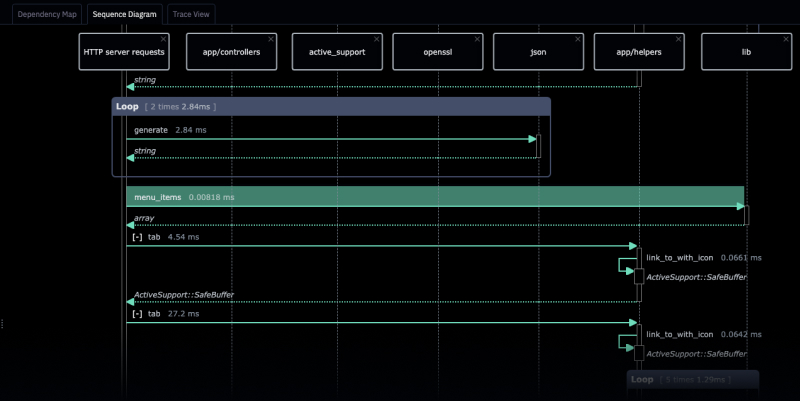
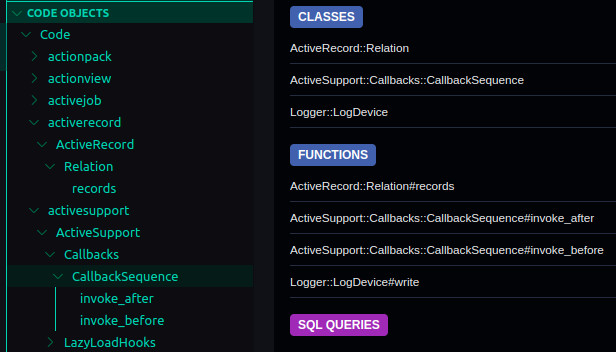
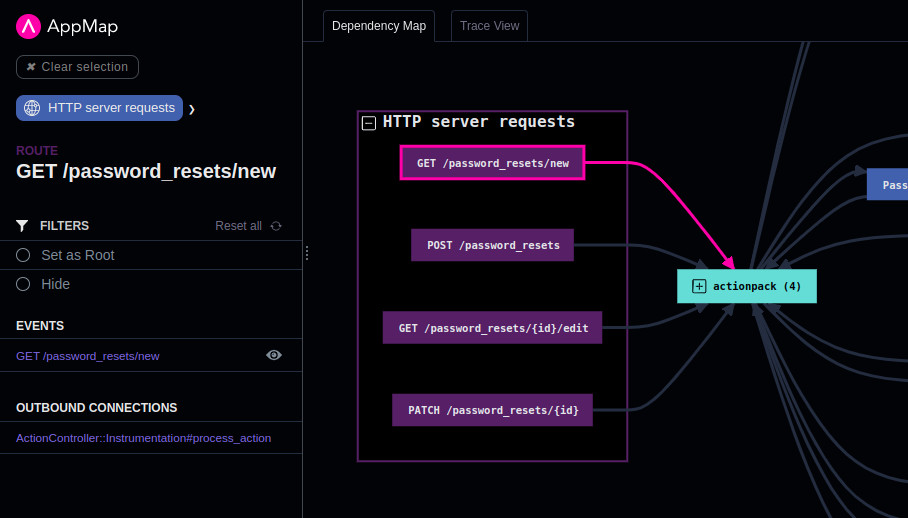
AppMap knows how popular frameworks like Spring, Rails, Django, and Express work. That means that when you view an AppMap, you'll only see the important parts of how an API request is handled.

For example, instead of seeing dozens of internal events related to how a framework receives data over TCP, manages its thread pools, and unmarshals payloads, you'll instead see something simple like HTTP POST.

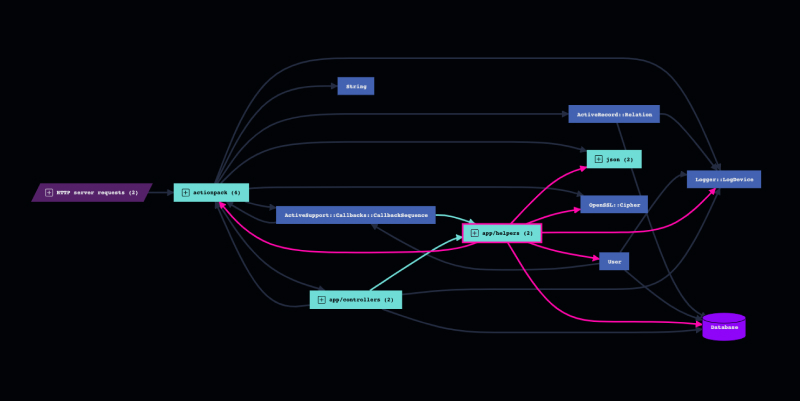
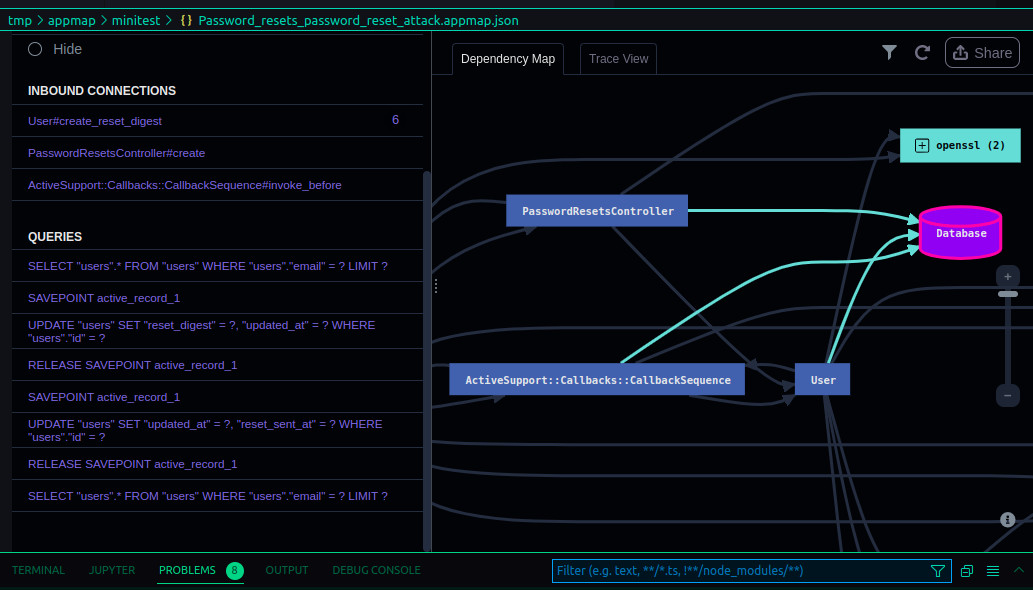
Since it knows how these frameworks operate internally, AppMap will also automatically label framework function calls that provide important services. For example, AppMap will apply the crypto.decrypt label to an OpenSSL decryption function call, or the security.authentication label to any call to a function that validates a user's identity. Those labels then make it easy to understand, search, and analyze code execution paths.