Performance Optimization

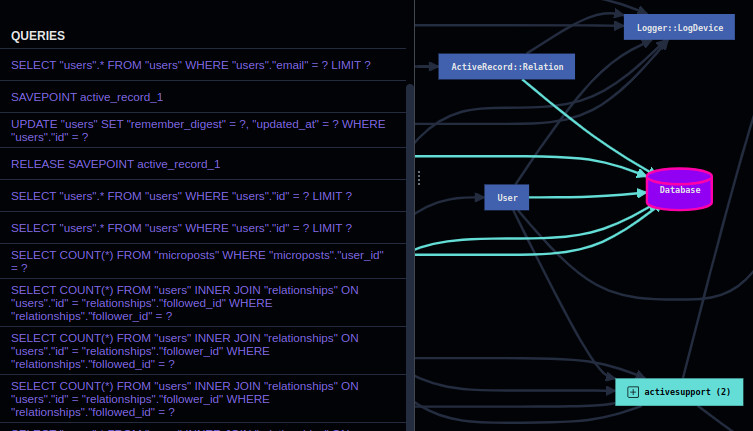
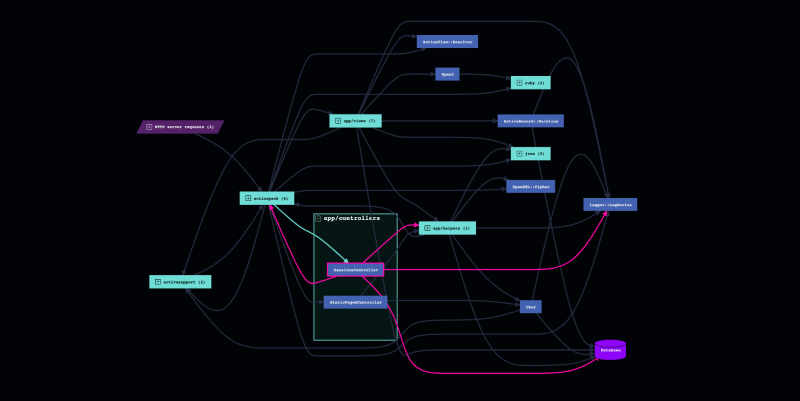
AppMap Diagrams are recordings of how your application executed at runtime. These AppMap Diagrams list the requests processed, which database queries were executed, how data was handled, and how long every function call took. AppMap Analysis instantly scans your AppMap Data for flaws that would likely make the system run slower when deployed to production. These flaws could also lead to expensive resource usage in the cloud, driving up operational costs.

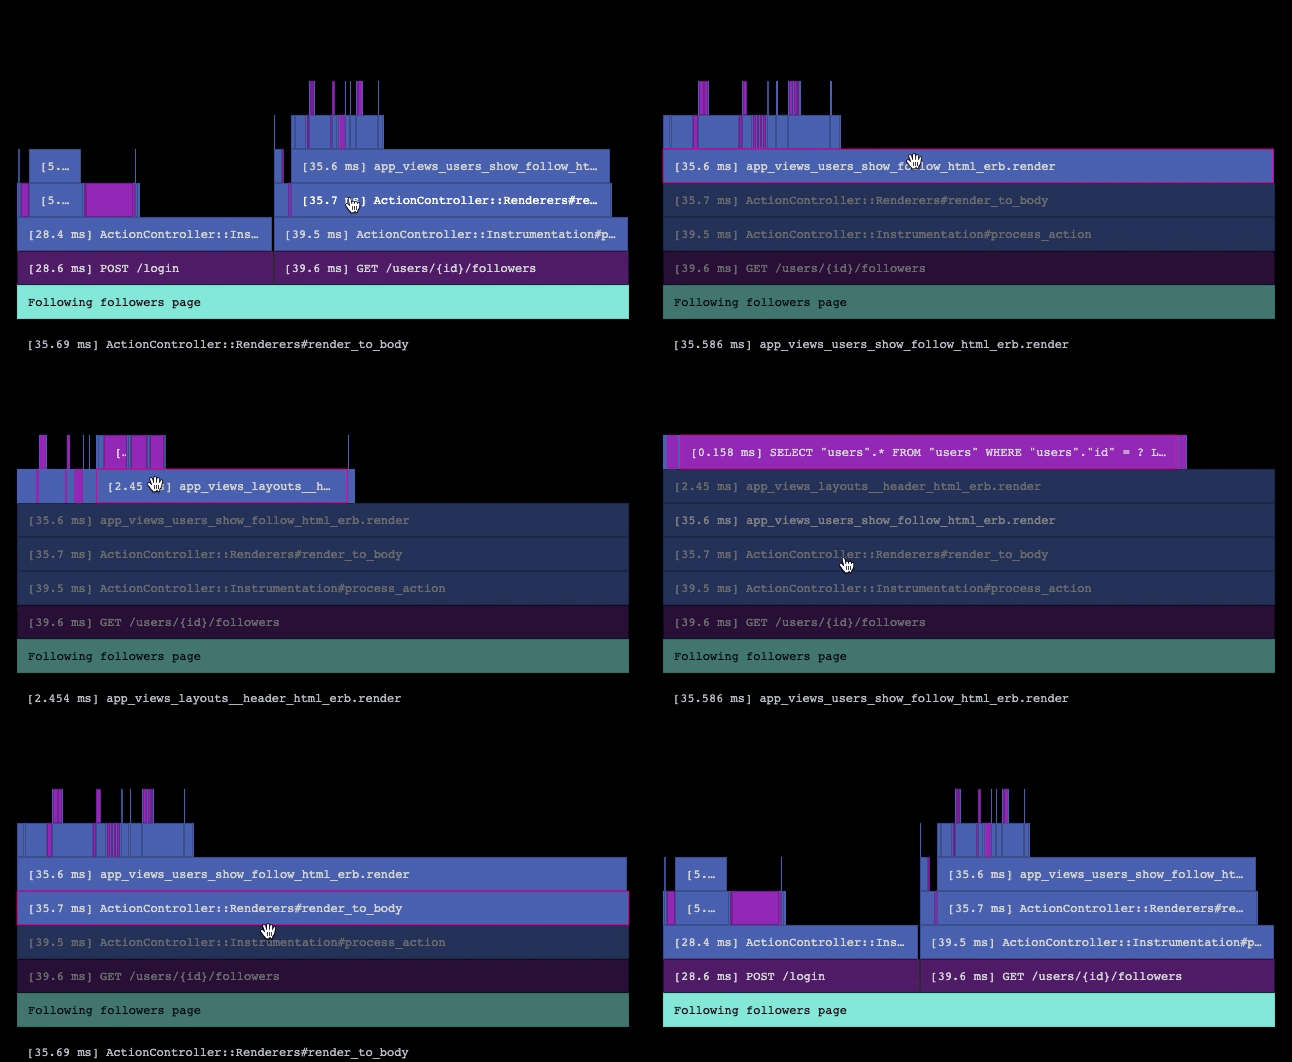
flamegraph image

Performance Issues That AppMap Can Identify

AppMap Analysis can highlight many performance flaws in your application code. The list below is just a small sample, but the full set is available in the reference documentation.

Repeated Database Queries

While processing a single HTTP request, applications usually query a database at least once. If the same database is queried multiple times with identical SQL while processing one API request, AppMap Analysis will flag this as an N+1 query issue. It's a common occurrence with framework-generated database code and persistence handlers, but one which can rapidly swamp the database.

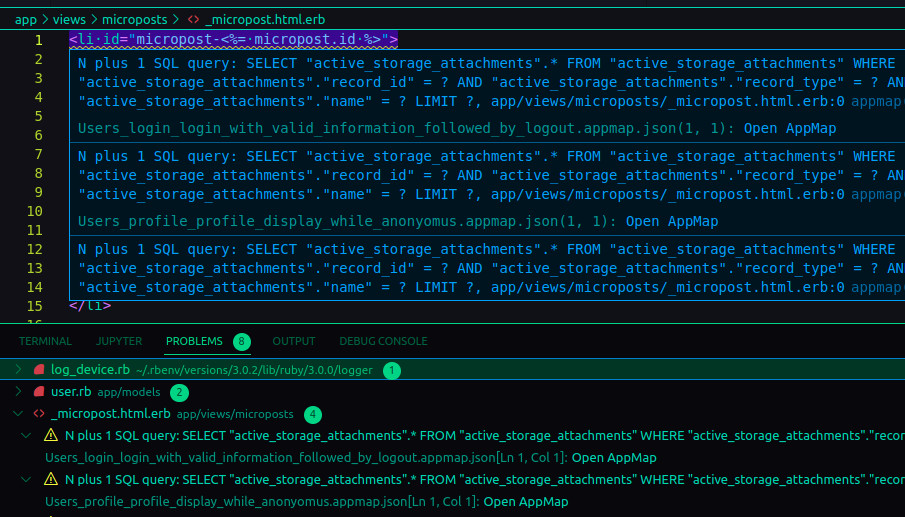
Applications perform better when they only make a single database query once and then re-use the results. When an N+1 query is discovered, AppMap will highlight each of the identical queries that it found in that AppMap and show the source code where each of the queries came from.

Slow Queries and Functions

Every database query and function call made while AppMap is recording an application's runtime behavior is timed. This allows for relative comparison of database query and function runtime performance before the code is even merged.

Using AppMap Analysis for slow query and function detection is a much safer way to analyze performance of an application's true dynamic behavior compared to testing in production. Analyzing performance with AppMap Analysis ensures that your customers won't experience degraded latencies caused by your application changes.

Oversized Queries

A common cause of both high database load and server memory exhaustion is queries loading too many results in a single query and materializing them into memory.

Imagine a query that loads all the rows from a table to do some aggregate computation on the entire set. When that table contains only a few dozen rows, no production monitoring tool will detect a problem, as the load will be neglible to retrieve and process the contents. But if that table soon grows to millions of rows, the query will grow with it.

AppMap Analysis will flag this pattern and recommend using a LIMIT or COUNT clause on the query, and for the application to either load the rows in small batches, or do the computation in the database itself.

Excessive Updates

A single HTTP update request (like a POST, PUT, or PATCH) should have responsibility for making only a small number of update or insert queries into a database. If the number of updates it makes becomes too large, the code becomes harder to maintain. It also makes it more fragile, as more things can fail and then potentially leave the database in an inconsistent state.

AppMap Analysis can locate all the update queries made within one HTTP request and flag those that exceed a configurable limit. This makes it easy to identify both current and future reliability and maintainability problems in your backend code.

The above are just a sample of rules available in AppMap Analysis. More rules are always being added!
performance optimization image

As soon as AppMap Data appears in your code editor, it is analyzed to find performance optimizations and anti-patterns that cause runtime inefficiencies. Any problems found will be highlighted in your editor almost immediately and linked to the places in the AppMap visualization showing the causes of the problem. The source code containing the flaws will also be highlighted to make it extremely easy to find and optimize the problem away.

AppMap Analysis is a next-generation performance analysis product. AppMap Analysis will pinpoint the exact parts of your application - right down to the lines of code - that can benefit from performance optimizations, and why.