To access the latest features update your code editor plugin. VS Code >= 0.118.1 and JetBrains >= 0.64.0
-
Docs
-
Reference
- AppMap for Visual Studio Code
- AppMap for JetBrains
- AppMap Agent for Ruby
- AppMap Agent for Python
- AppMap Agent for Java
- AppMap Agent for Node.js
- AppMap for Java - Maven Plugin
- AppMap for Java - Gradle Plugin
- AppMap Agent for JavaScript (legacy)
- Command line interface (CLI)
- Remote recording API
- Analysis Rules
- Analysis Labels
- GitHub Action
- License Key Installation
- Uninstalling AppMap
- Community
AppMap Analysis
When there is AppMap Data available in your project, AppMap Runtime Analysis will immediately scan them to detect flaws in the code. These flaws are surfaced as findings and are displayed in your code editor as you work so that they can be addressed before they are propagated to test or production environments.
Navigate findings
AppMap makes information about findings available in two main locations:
The Runtime Analysis step of the setup instructions
Visual Studio Code
JetBrains editors
The Runtime Analysis sidebar pane
In Visual Studio Code, findings are displayed In the Runtime Analysis sidebar pane sorted by impact category and type.
Clicking the ‘Overview’ link in the Runtime Analysis sidebar will open the ‘Runtime Analysis Summary’ window which contains a summary of findings for a particular project.
In this video
AppMap Analysis scans your AppMap Data to find software design flaws that impact performance, stability, security and maintainability. This runtime code analysis can find the problems that static code analyzers miss - and that cause 90% of today’s most serious production issues.Links mentioned
AppMap Community Slack
Get AppMap for VSCode
Get AppMap for JetBrains
Follow along
AppMap Analysis is available for both JetBrains IDEs and Visual Studio Code.
Investigate findings
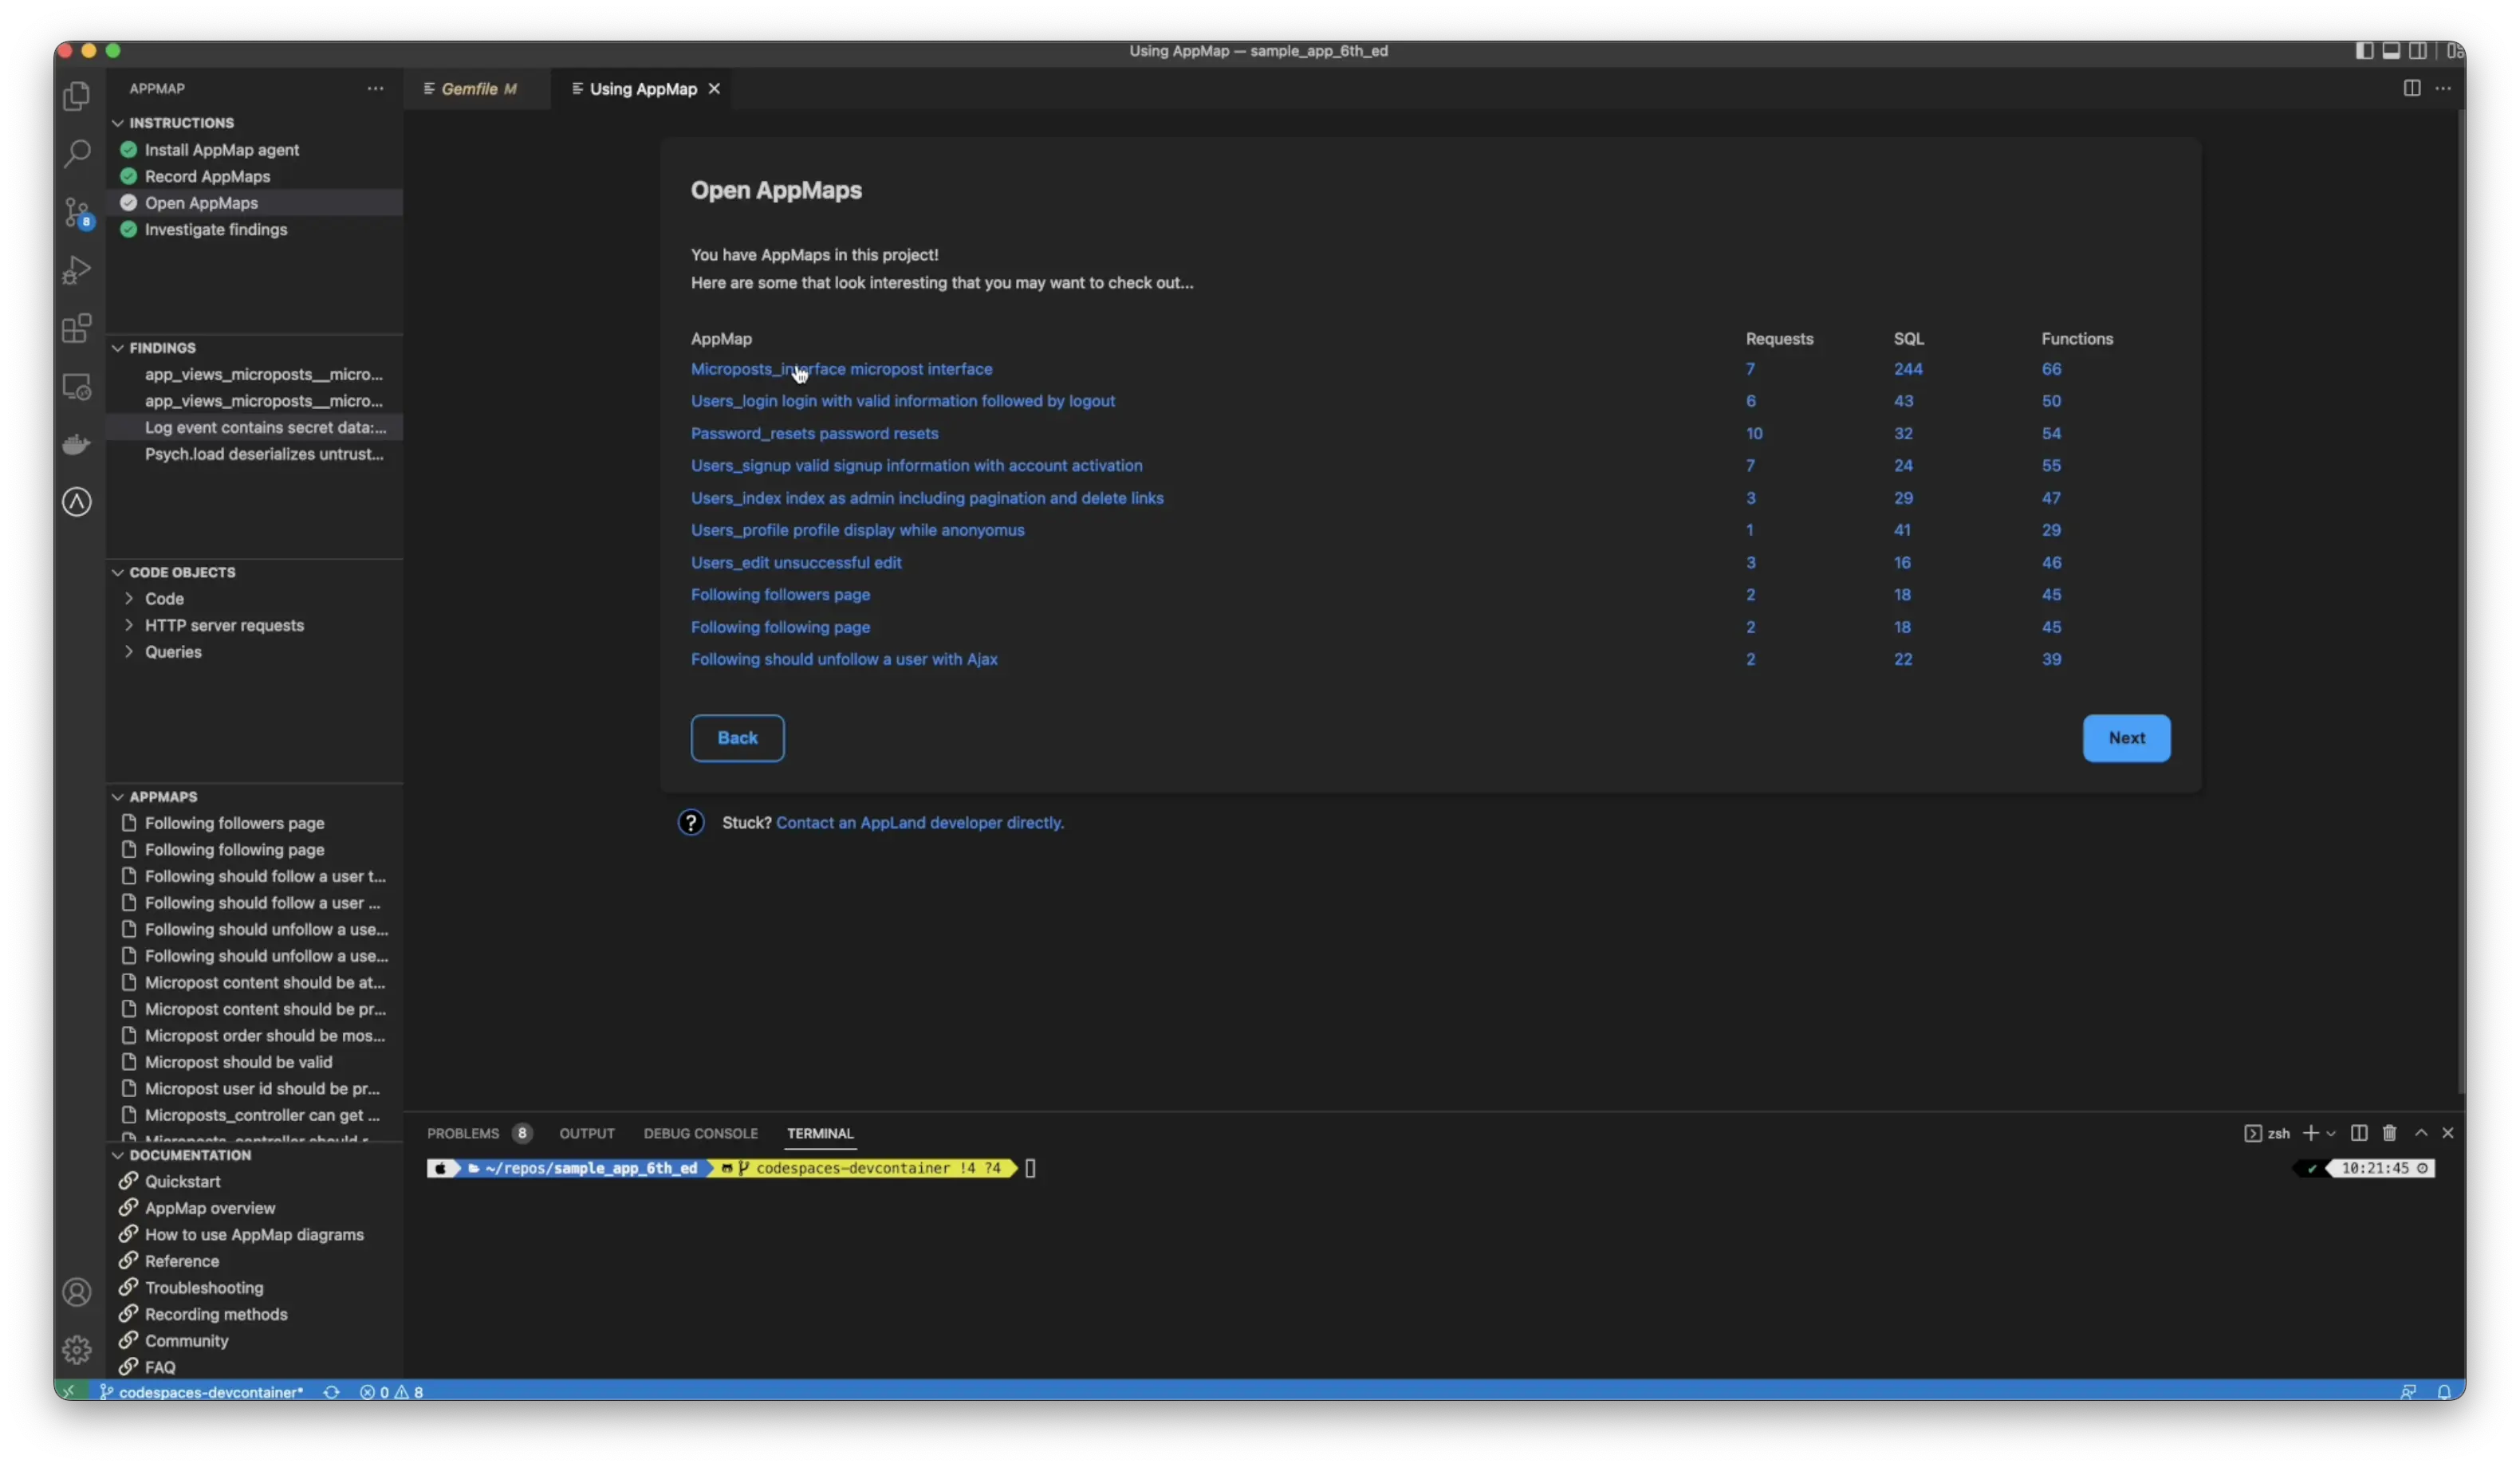
Let’s look at a sample Ruby on rails application, where AppMap has already been installed and AppMap Data has been generated. From the test cases, you’ll see a new option for findings in the left-hand column or an option here for investigate findings.

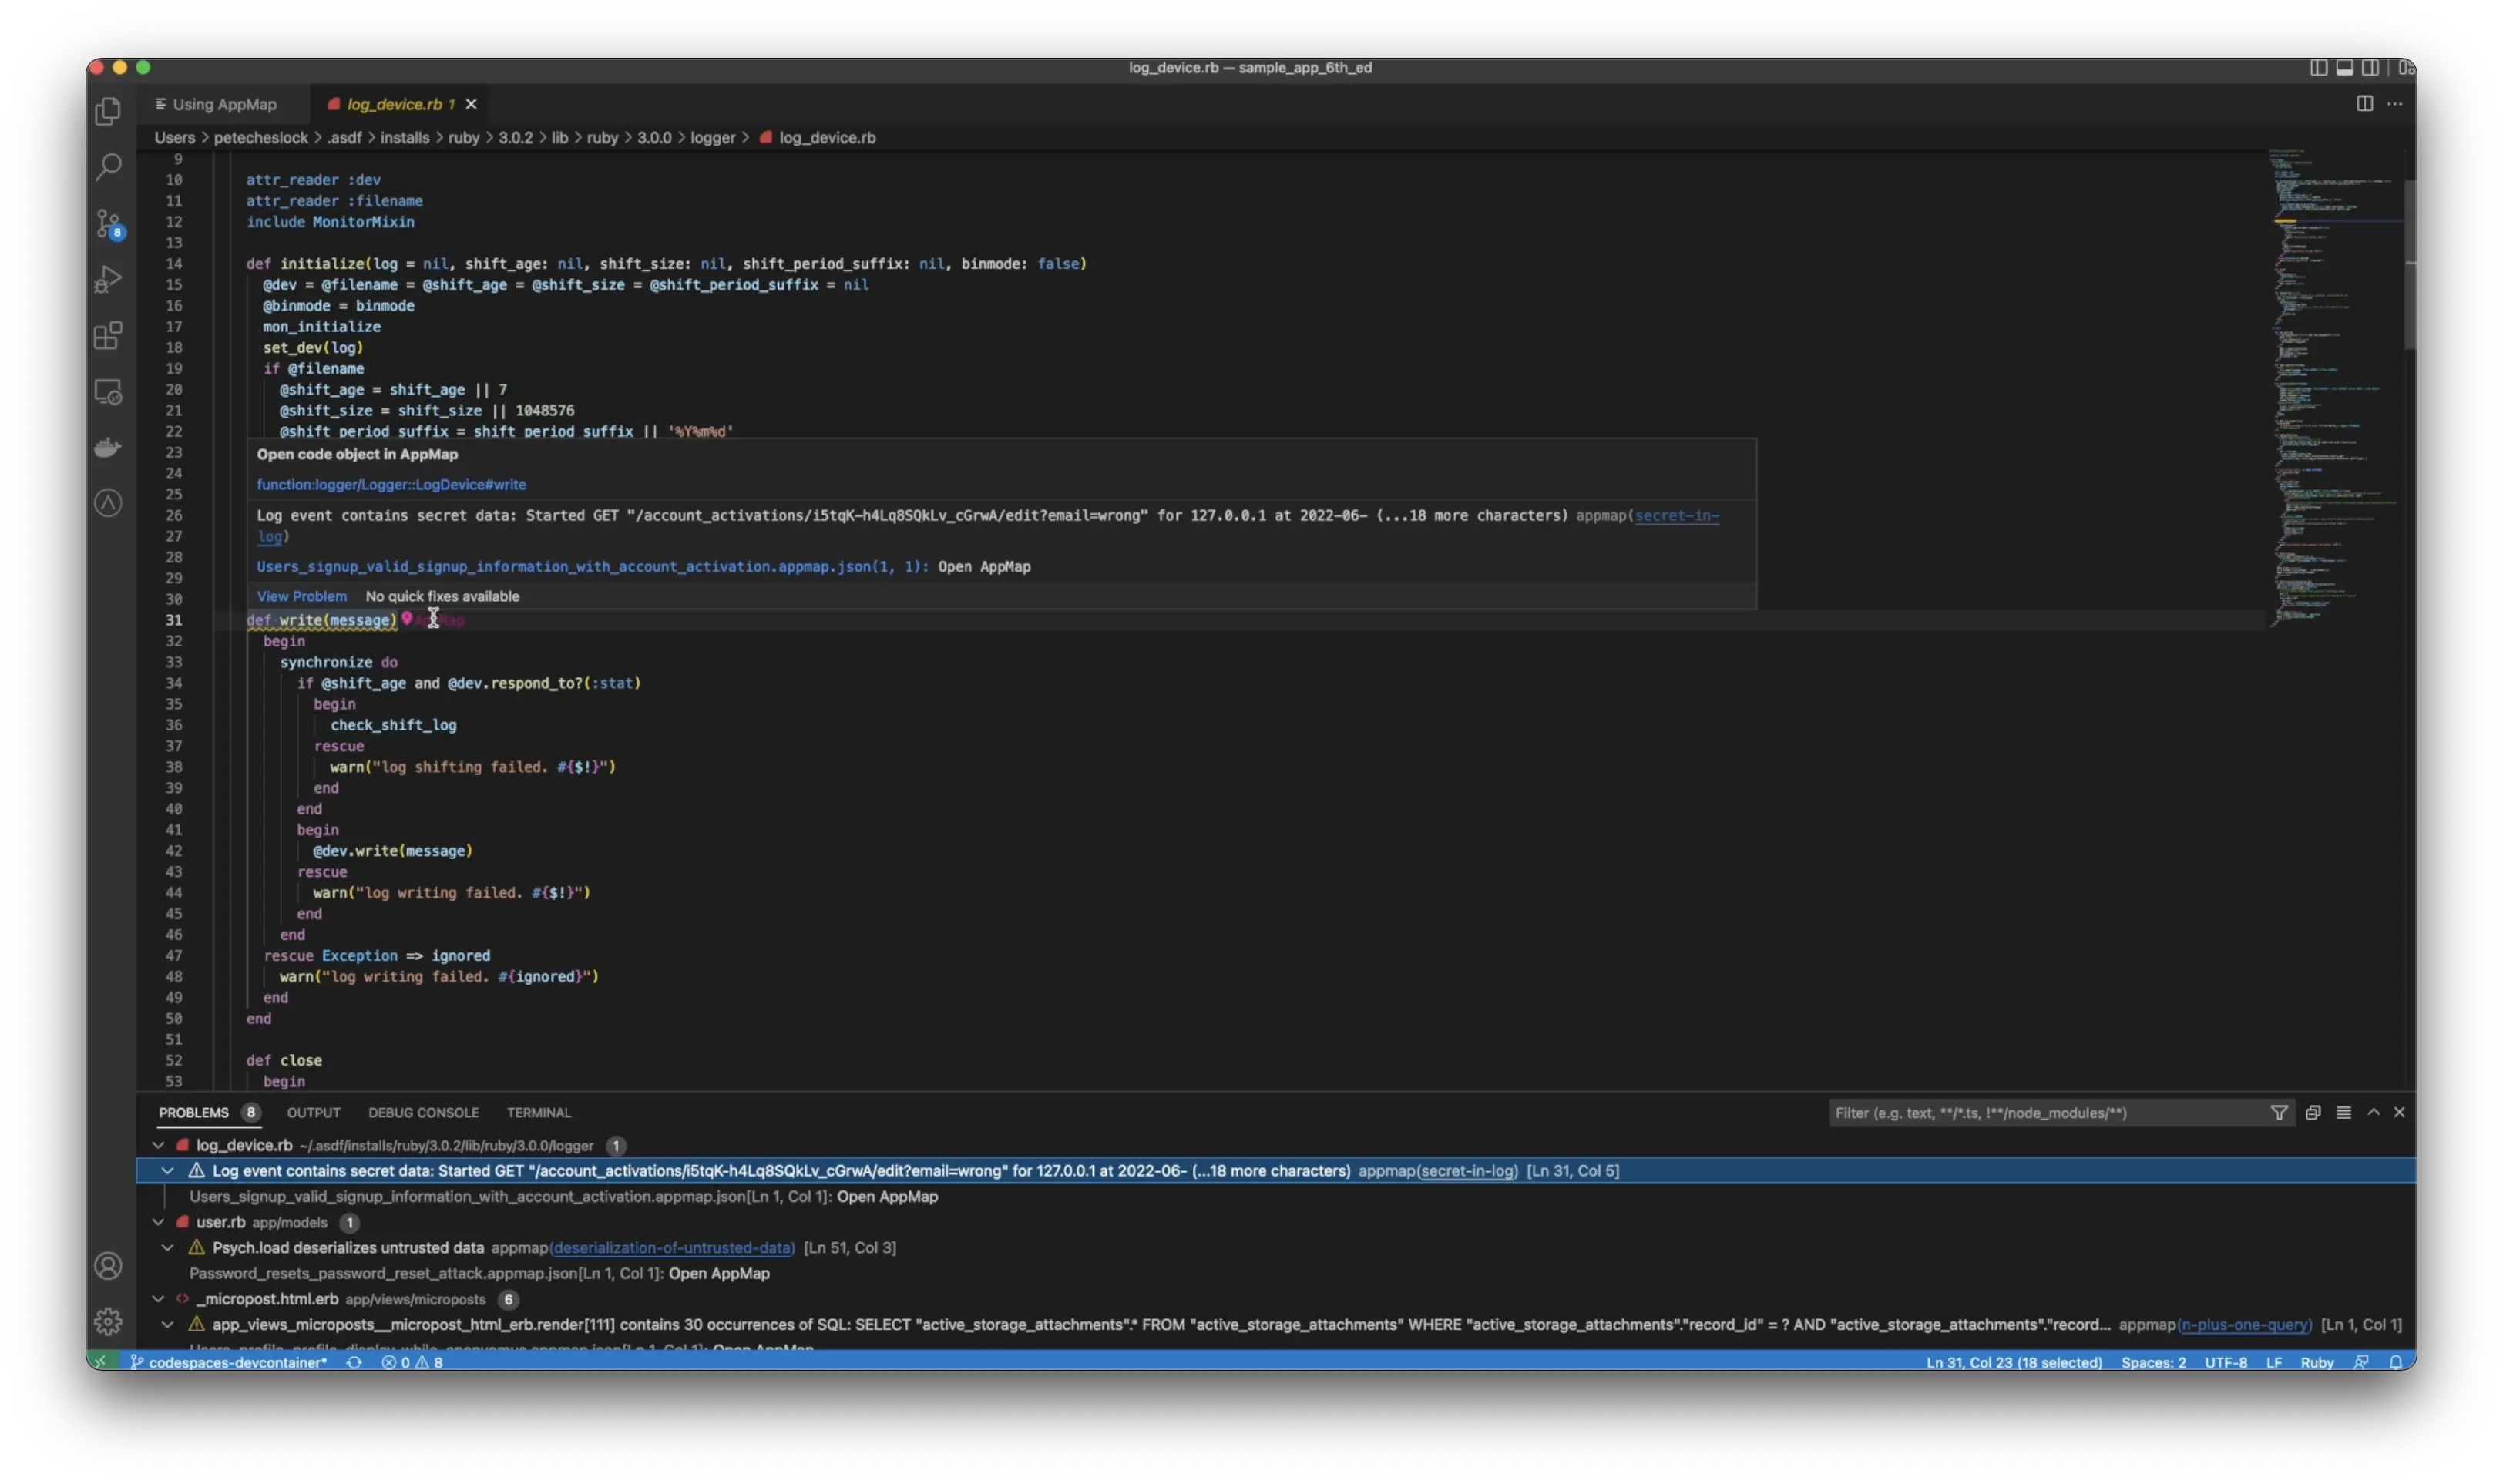
You can see one of the issues we’ve found is that a log event contained secret data by clicking on the finding will be taken directly to the line of code where this event occurs by hovering over the pin.

Use labels to visually explore your code
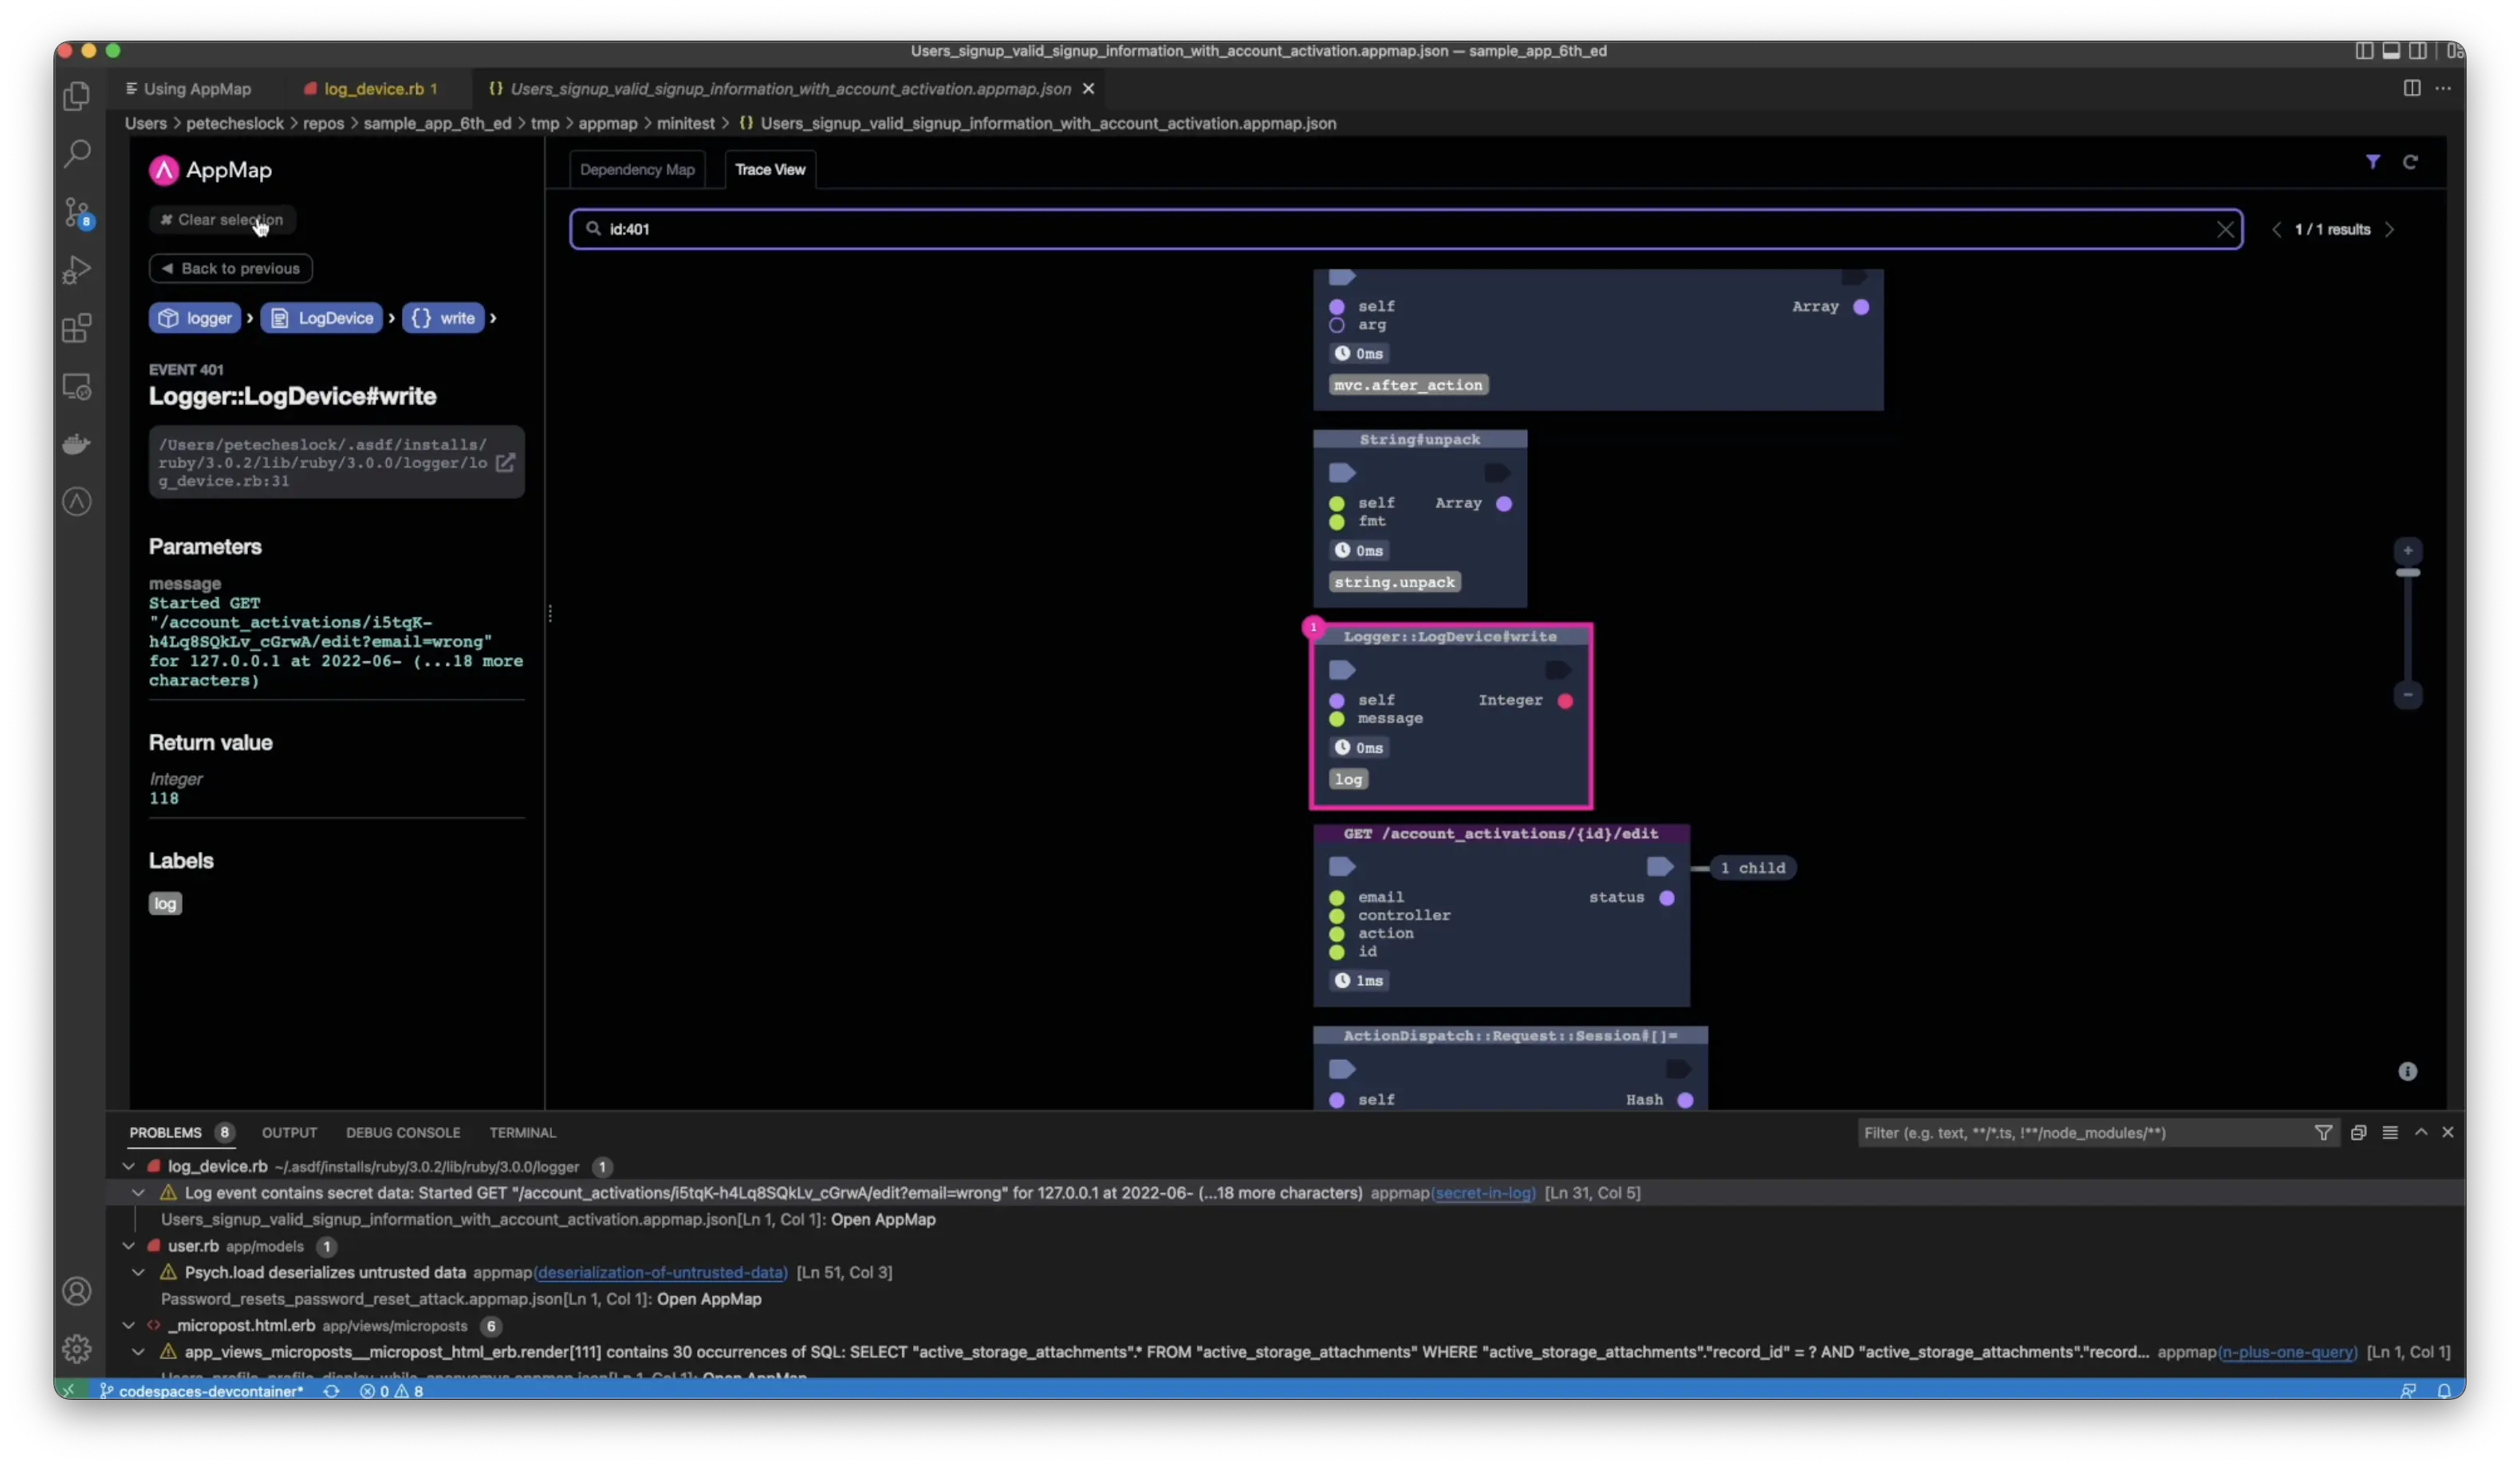
You can open the AppMap and see exactly where the function wrote this secret to a log file. How does AppMap know that this was a secret? Unlike static analyzers and other tools that do pattern matching AppMap knows this function generates secrets because we have built in knowledge of common software libraries with pre-populated labels.
We know exactly where to look to avoid false positives. Developers can extend their labels, whether it’s a common library or not with simple code comments on their functions.

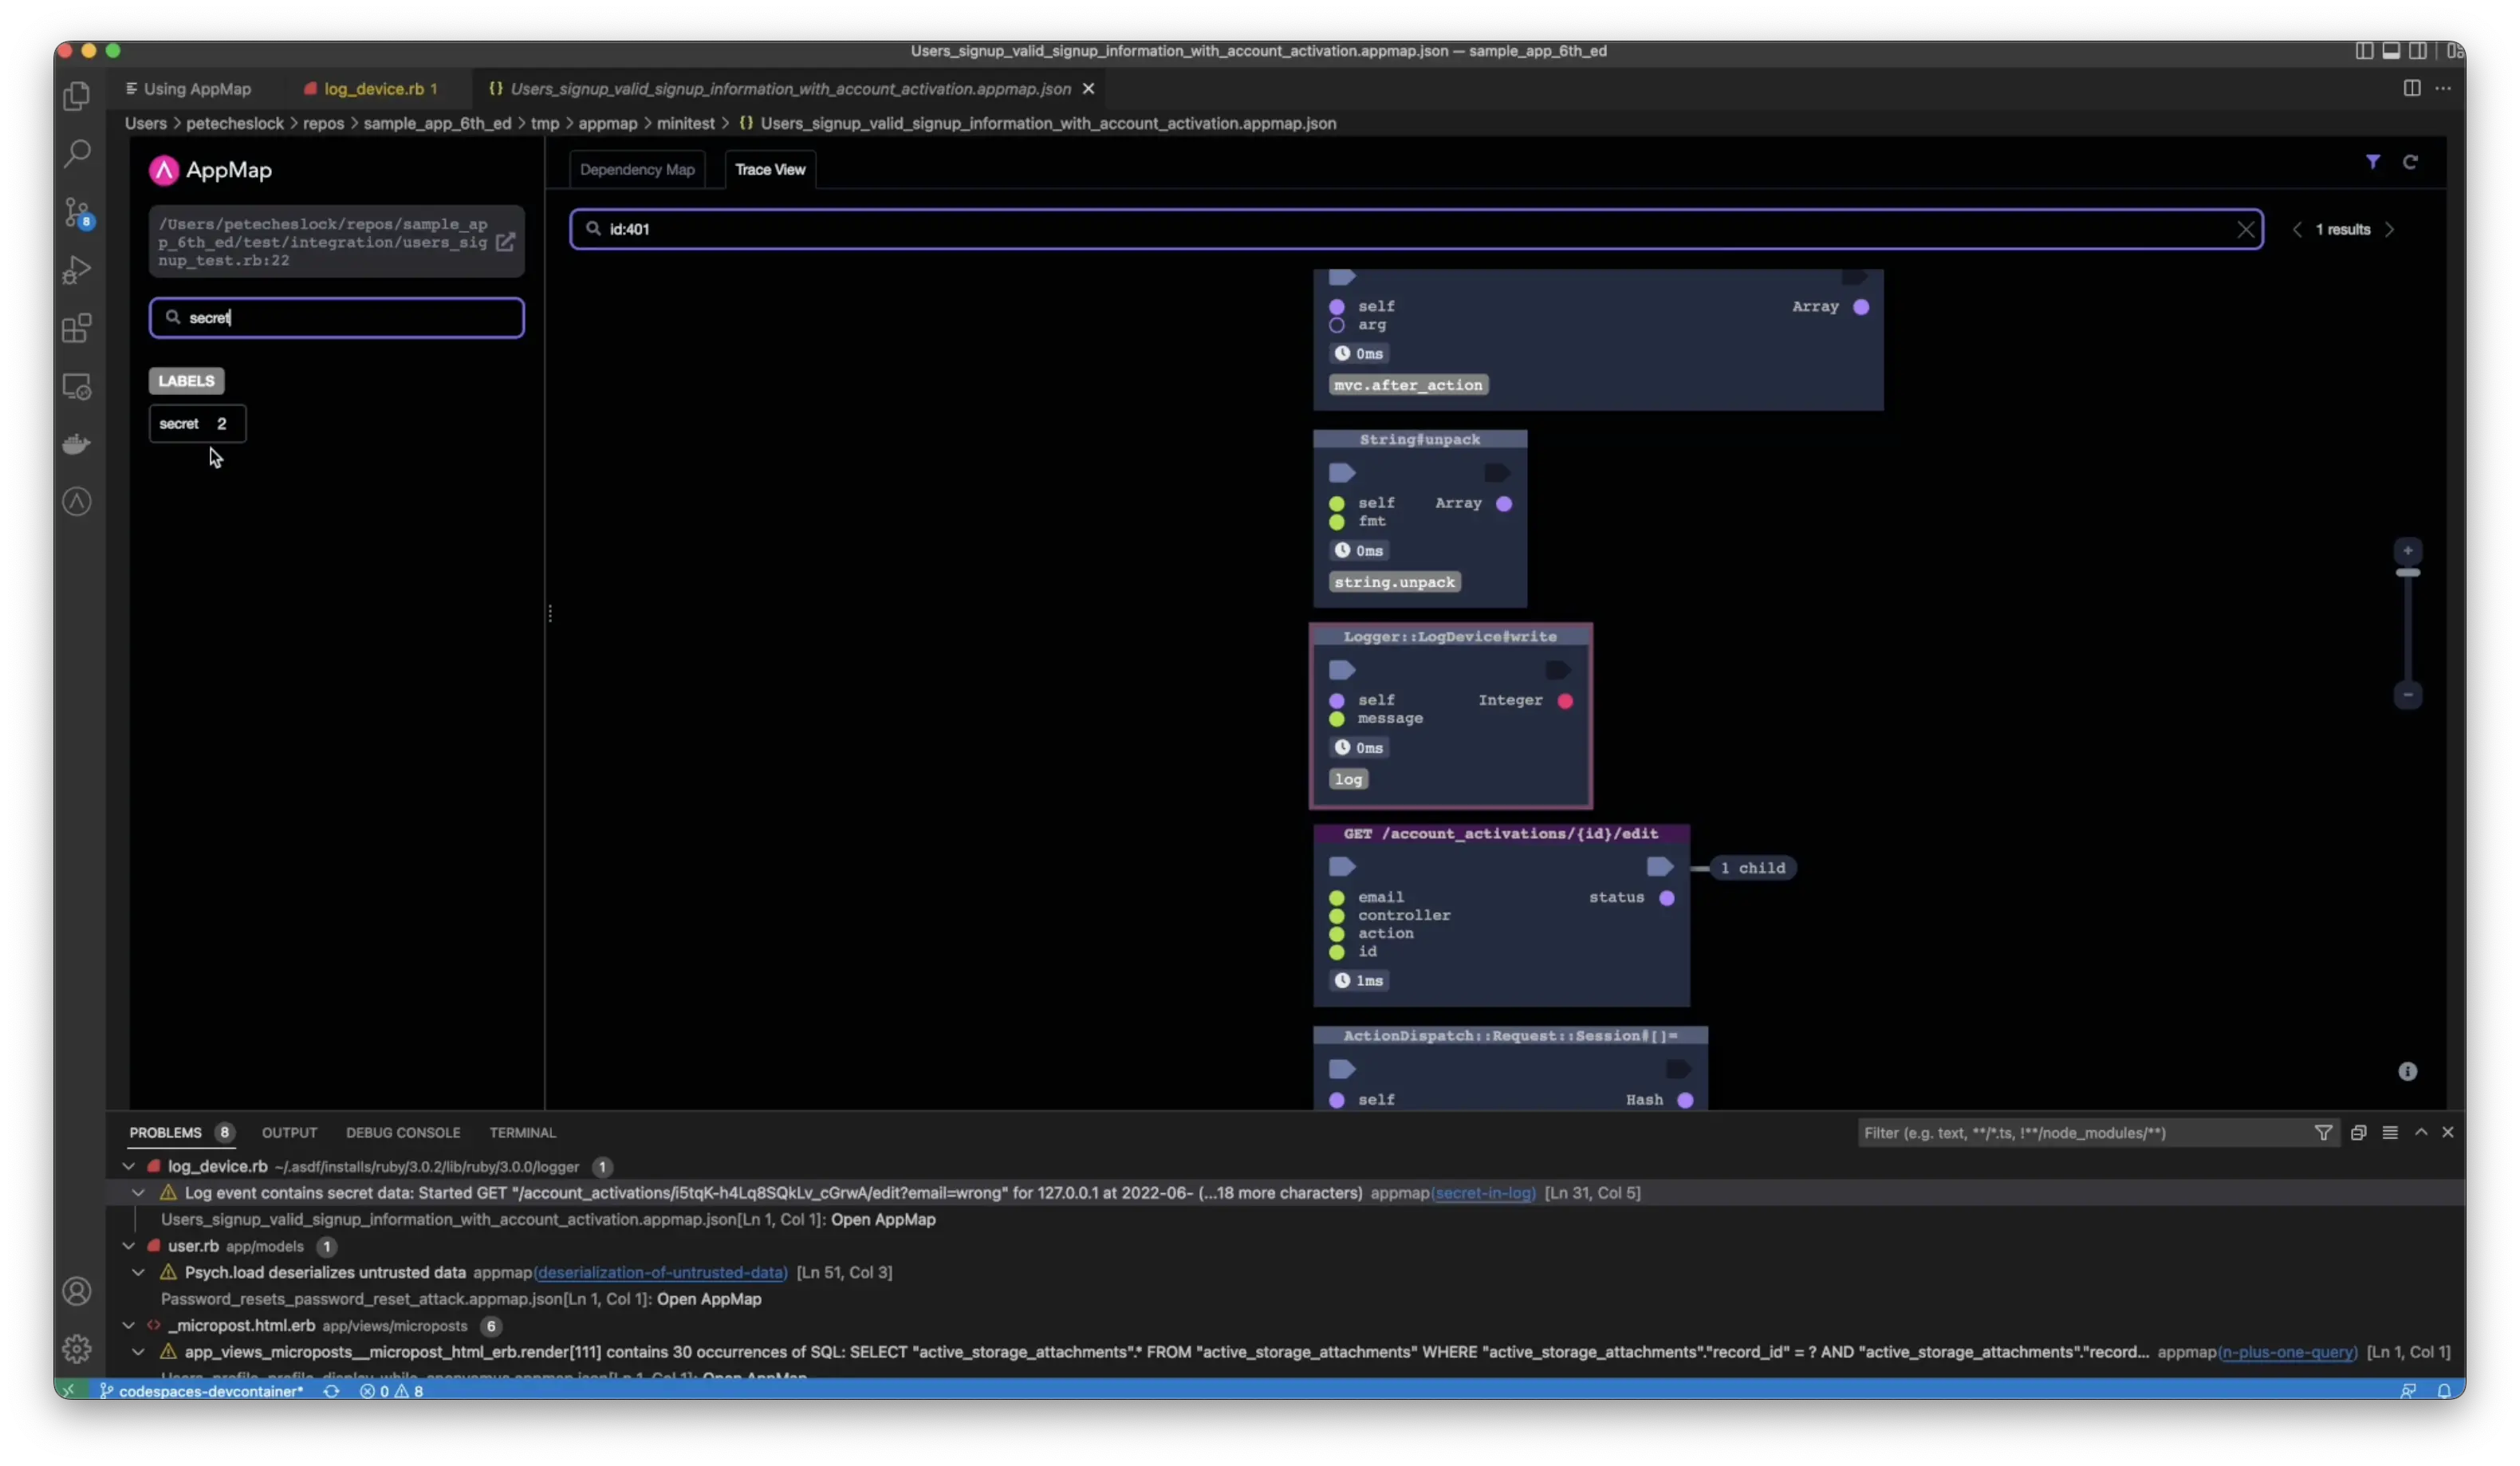
If you search for the secret label, you’ll see the location in the code where this event occurs by clicking on the function, you’ll be taken to the exact location of the AppMap, where the secret was generated. Additionally, you can open the code, combining a visual model alongside the code.

Next step: Join the AppMap Community
Thank you for your feedback!
