To access the latest features keep your code editor plug-in up to date.
-
Docs
-
Reference
- AppMap for Visual Studio Code
- AppMap for JetBrains
- AppMap Agent for Ruby
- AppMap Agent for Python
- AppMap Agent for Java
- AppMap Agent for Node.js
- AppMap for Java - Maven Plugin
- AppMap for Java - Gradle Plugin
- AppMap Command line interface (CLI)
- Remote recording API
- Analysis Labels
- Analysis Rules
- License Key Installation
- Subscription Management
- AppMap Offline Install for Secure Environments
- Uninstalling AppMap
Advanced AppMap Data Management- Community
Reverse Engineering with AppMap
- Introduction
- Pre-requisites
- Step 1: Install the AppMap extension for your code editor
- Step 2: Make AppMap Diagrams for one aspect of your code
- Step 3: Use AppMap Diagrams in your code editor
- Step 4: Share AppMap Diagrams with your team
- Step 5: Automate collection and storage of AppMap Data
- Step 6: Use AppMap Diagrams to investigate a code issue - Obtain the archive
- Step 7: Improve application coverage
- Next Steps - AppMap analysis
Introduction
AppMap is a powerful tool for reverse-engineering legacy code. Unlike telemetry-based approaches, no modifications to the source code are needed. Simply run the application with the AppMap recording agent enabled, and all the details of code execution are recorded into plain JSON files. These files contain HTTP server requests, internal function calls, SQL, HTTP client requests, and more. AppMap can render this data in powerful interactive visualizations, including dependency map, sequence diagram, trace view, and flame graph.
The data can be further combined, compared, and analyzed to obtain key insights about how the code works and how it can be improved. The purpose of this guide is to provide a step-by-step procedure for characterizing a large codebase with AppMap and obtaining these insights.
Pre-requisites
You should first review our guide on how to make AppMap Data.
Reverse Engineering an Application - A Step by Step Process
This section provides a procedure for characterizing your code using AppMap. Consider this procedure as a recommendation on how to get started. For your specific needs, you’ll likely find useful ways to extend and customize these recommendations.
Step 1: Install the AppMap extension for your code editor
The code editor is the best way to get started using AppMap. Install the AppMap extension for VSCode or JetBrains, then follow the install workflow that will be prompted inside the code editor.
Add AppMap to your project
Note (Monorepo / Multi-project) If you have an “umbrella” project that contains multiple sub-projects, aka “monorepo”, choose one project to start. The best choice is a web application or web service API, since AppMap is optimized for web apps.
Here’s a checklist:
- ☐ Prepare a working development environment for your project. Confirm that you can either run the application locally or in a Docker container. If your project has test cases, confirm that they are working as expected.
- ☐ Create a new branch of the code, called
install-appmap. - ☐ Install AppMap extension for the code editor.
- ☐ When prompted, Activate AppMap using GitHub or GitLab OAuth. You’ll be redirected back to your code editor.
- ☐ Open the Install instructions, which are built into the code editor via the AppMap extension.
- ☐ Select the project you want to configure for AppMap.
- ☐ Ruby, Python - Add the AppMap language agent to your project
- ☐ Java - Confirm that the AppMap agent JAR is downloaded, and that you have a Run Configuration (JetBrains) or Launch Configuration (VSCode) that configures the JVM to load the AppMap agent JAR. You can also install AppMap for Maven and/or Gradle, as you wish. This will make it easier to make AppMap Data from the command line - you may or may not care about that right now.
- ☐ Node.js - Change how you launch your application by prepending
npx appmap-nodeto it. - ☐ Confirm that the AppMap configuration is working. You can do this by either: a) Recording a test case, or b) Starting your application and making requests recordings.
Note (Java) AppMap recording depends on having the AppMap Java agent enabled in your process using the javaagent JVM argument. The AppMap extension will download the AppMap Java agent to $HOME/lib/java. However this may be blocked in certain corporate environments. You can download the AppMap Java agent manually from GitHub. Different tools (IntelliJ, Maven, Gradle, Tomcat etc) have different ways of specifying JVM arguments. AppMap does provide plugins for Maven and Gradle - these can be helpful in many cases. Or you can configure the javaagent flag yourself using online resources and examples.
Commit your changes
At this point, you’ve added AppMap to your project and confirmed that it’s working. Prepare a commit that includes:
- Any modified package management files (e.g.
pom.xml,requirements.txt,Gemfile,package.json,yarn.lock, etc.). appmap.yml- Recommended project extensions, e.g.
extensions.json .gitignoreof the AppMap directory
Note (Monorepo / Multi-project) The package management and
appmap.ymlchanges should be within the sub-project that you’re configuring for AppMap. Theextensions.jsonwill be in the project root directory.Step 2: Make AppMap Diagrams for one aspect of your code
In a large project, it’s best to start making AppMap Diagrams in one functional area. For example, suppose you want to characterize the login and password reset functionality.
Run applicable test cases
Start by recording any test cases that are applicable to this functional area. Test cases that traverse through the HTTP and SQL stack are the most useful. Unit tests and tests that mock or stub SQL are of less utility, since they don’t show the actual behavior of the application API and interactions with the data store. If you don’t have relevant tests - or just can’t easily determine if you do or not - proceed to the next step: requests recording.
If you have a really large test suite, it’s useful to start generating AppMap Data of a subset of it, to make the turnaround times quicker for getting through this process.
Language Test Framework Subsetting Strategy Ruby rspecEnable tests selectively with the rspec tag appmap: true.
Runrspec -t @appmap=trueJava JUnitRun specific tests from the IDE UI. Use VSCode Launch configuration or IntelliJ “Start with AppMap” Python pytestFilter by test names using the -kargument.Python unittestSpecify tests using the -margument, or aggregate usingunittest.TestSuiteNode jestPass jest a path to a directory of tests, or use -tto run tests matching a regex patternNode mochaPass mocha a path to a directory of tests, or use --grepto run tests matching a regex patternTest subsetting strategies
Expand AppMap coverage with requests recording
You can expand your AppMap coverage beyond what’s available with your test suite using Requests recording.
Requests recording is like a “live mode” for making AppMap Diagrams - it emits AppMap Data as you use the app. To continue the example of characterizing the login + password flow, start your application with AppMap enabled. Then proceed through a predefined user flow - for example: login in, unable to login, request a password reset. QA scripts will often provide reproducible scenarios like this for stepping through the application. If no QA scripts are available, just step through the application as a user would. As you interact with the application, “requests recording” will be create an AppMap Diagram for every request. You can find them in
$appmap_dir/requests. Open any AppMap from this folder to visualize the end-to-end code behavior for that request.Step 3: Use AppMap Diagrams in your code editor
Inspect a specific request
AppMap Diagrams that contain HTTP server requests contain the most rich and useful data. Open the AppMap view in your code editor. There you’ll find a section called “Code objects”. It contains all the HTTP server routes and SQL statements that have been recorded in your AppMap Diagram. It also contains a tree of Code, which you can expand from packages into classes and functions.
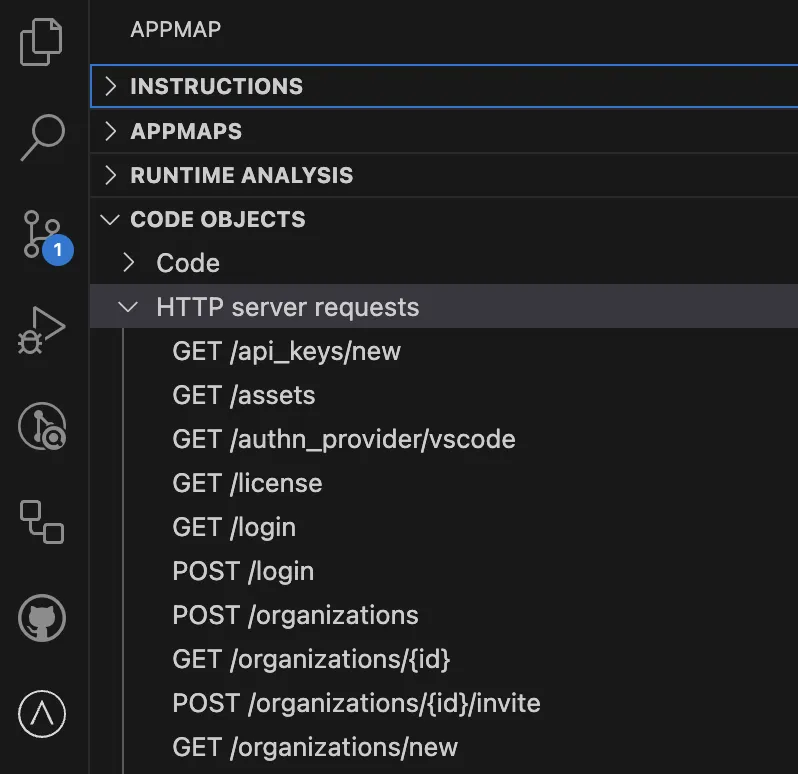
Choose an HTTP server request and click on it. If there is one AppMap of that route, it will open in your code editor. If there are multiple AppMap Diagrams of that route, you’ll be prompted to choose one.
This is an example of a test case AppMap. It includes 4 HTTP server requests, plus code and SQL.
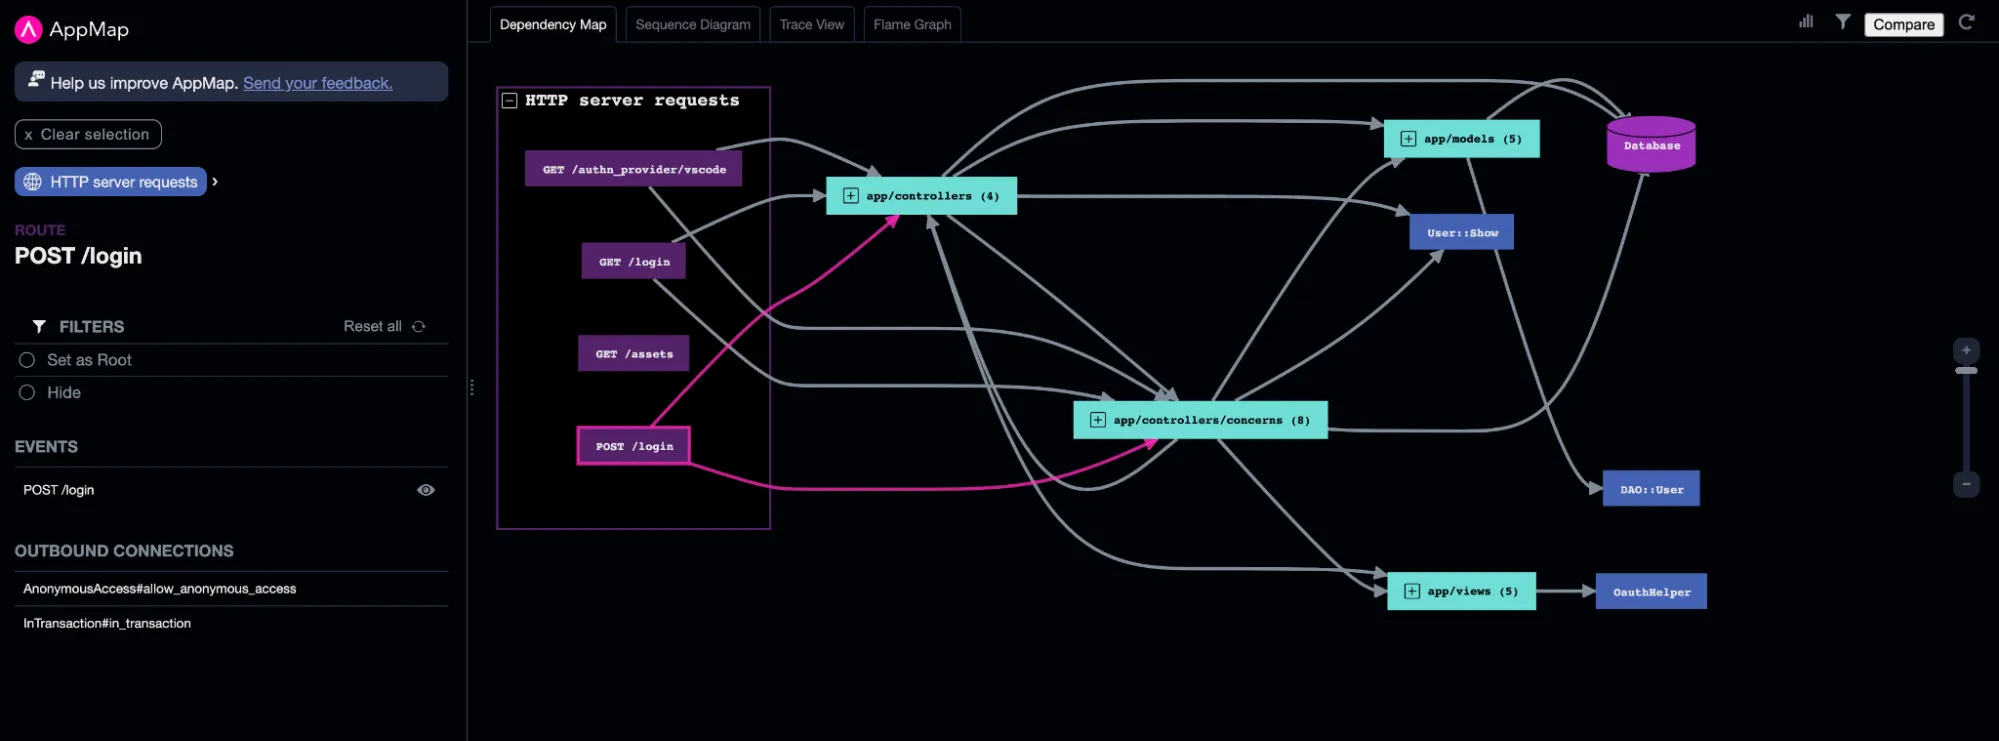
You can download this file if you’d like to open it within your code editor.
Declutter your AppMap
One of the challenges with reverse engineering large applications is that the AppMap Data can be large and complicated. AppMap offers tools to declutter and filter your AppMap Data. We will look more closely at that here.
Hide a function
In most code bases, there are a few very frequently occurring functions that are mostly noise. You can take two steps to declutter your diagram and reduce the noise.
Open the AppMap stats using the icon in the top-right corner of the AppMap.

You’ll see a list of the most frequently occurring methods.


Click on one of these methods to reveal it in the diagram, and on the left hand side panel. Then click “Hide” to remove all occurrences from the display.
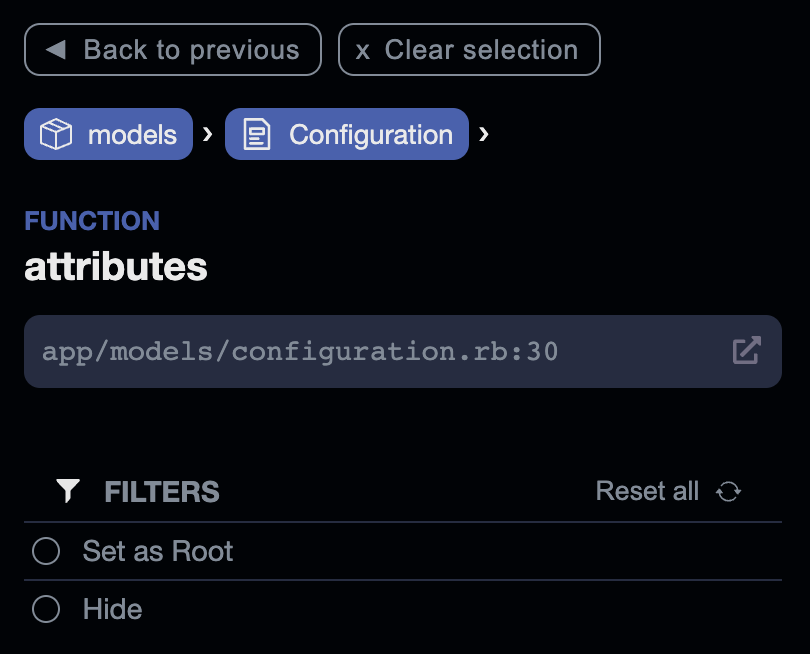
To reveal it again, you can use “Reset all”, or open the Filter menu pop up where you will see a list of all hidden code objects.
Exclude a function from future AppMap Diagrams
You can also go further, by excluding a class function from the AppMap at recording time. To do this, you’ll add a line to your
appmap.yml. Consult the reference for your language agent. For example, in Java you can exclude specific functions like this:packages: - path: com.mycorp.myproject exclude: [ com.mycorp.myproject.MyClass#MyMethod ]This function will be excluded from all future AppMap Diagrams. Some language agents also support exclusion by wildcard.
Set the Root event
You can also choose any event in the AppMap to be the root event. Only descendants of this event will be displayed.
You can clear the root by clicking
Reset all.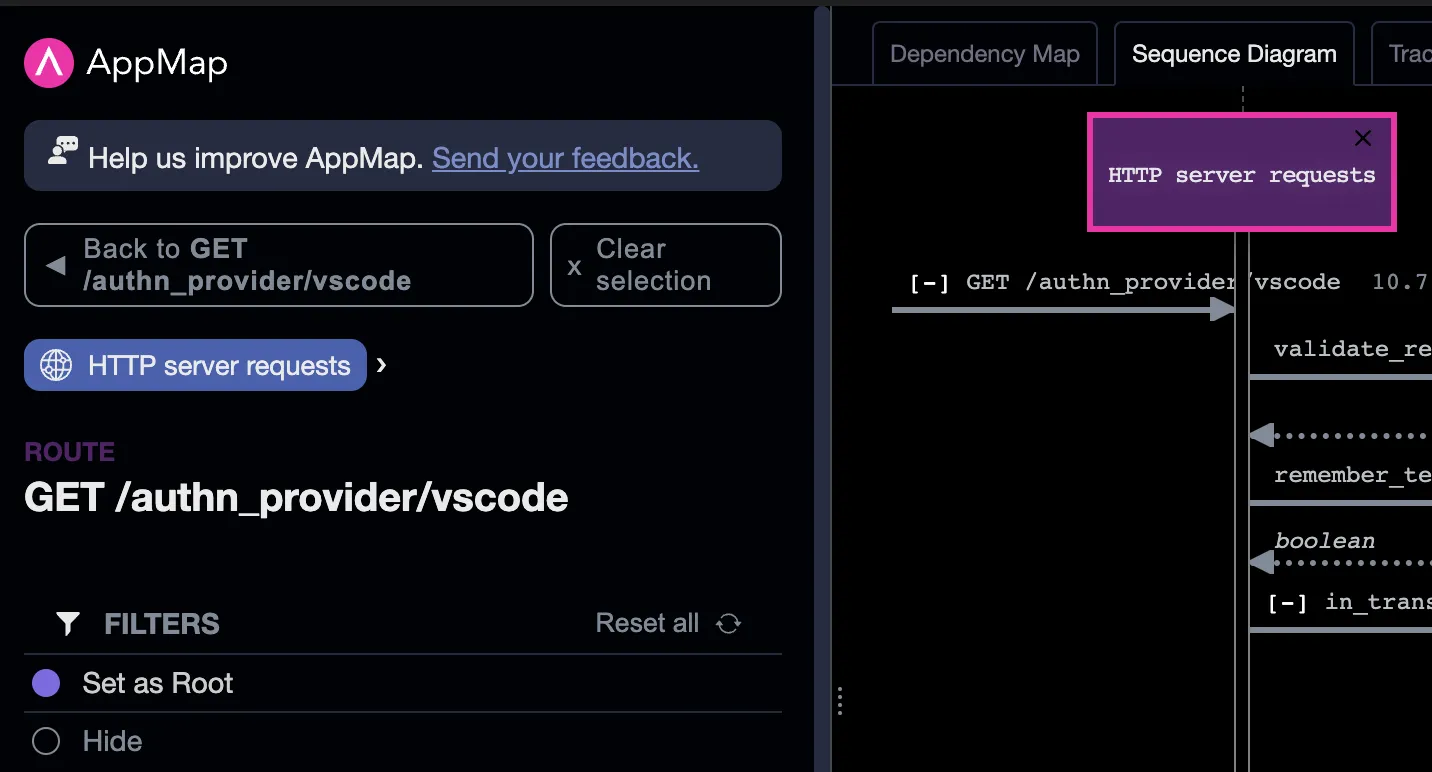
Inspect timing and performance
Use the filter
Hide elapsed time underto focus the diagram only on slow functions and queries.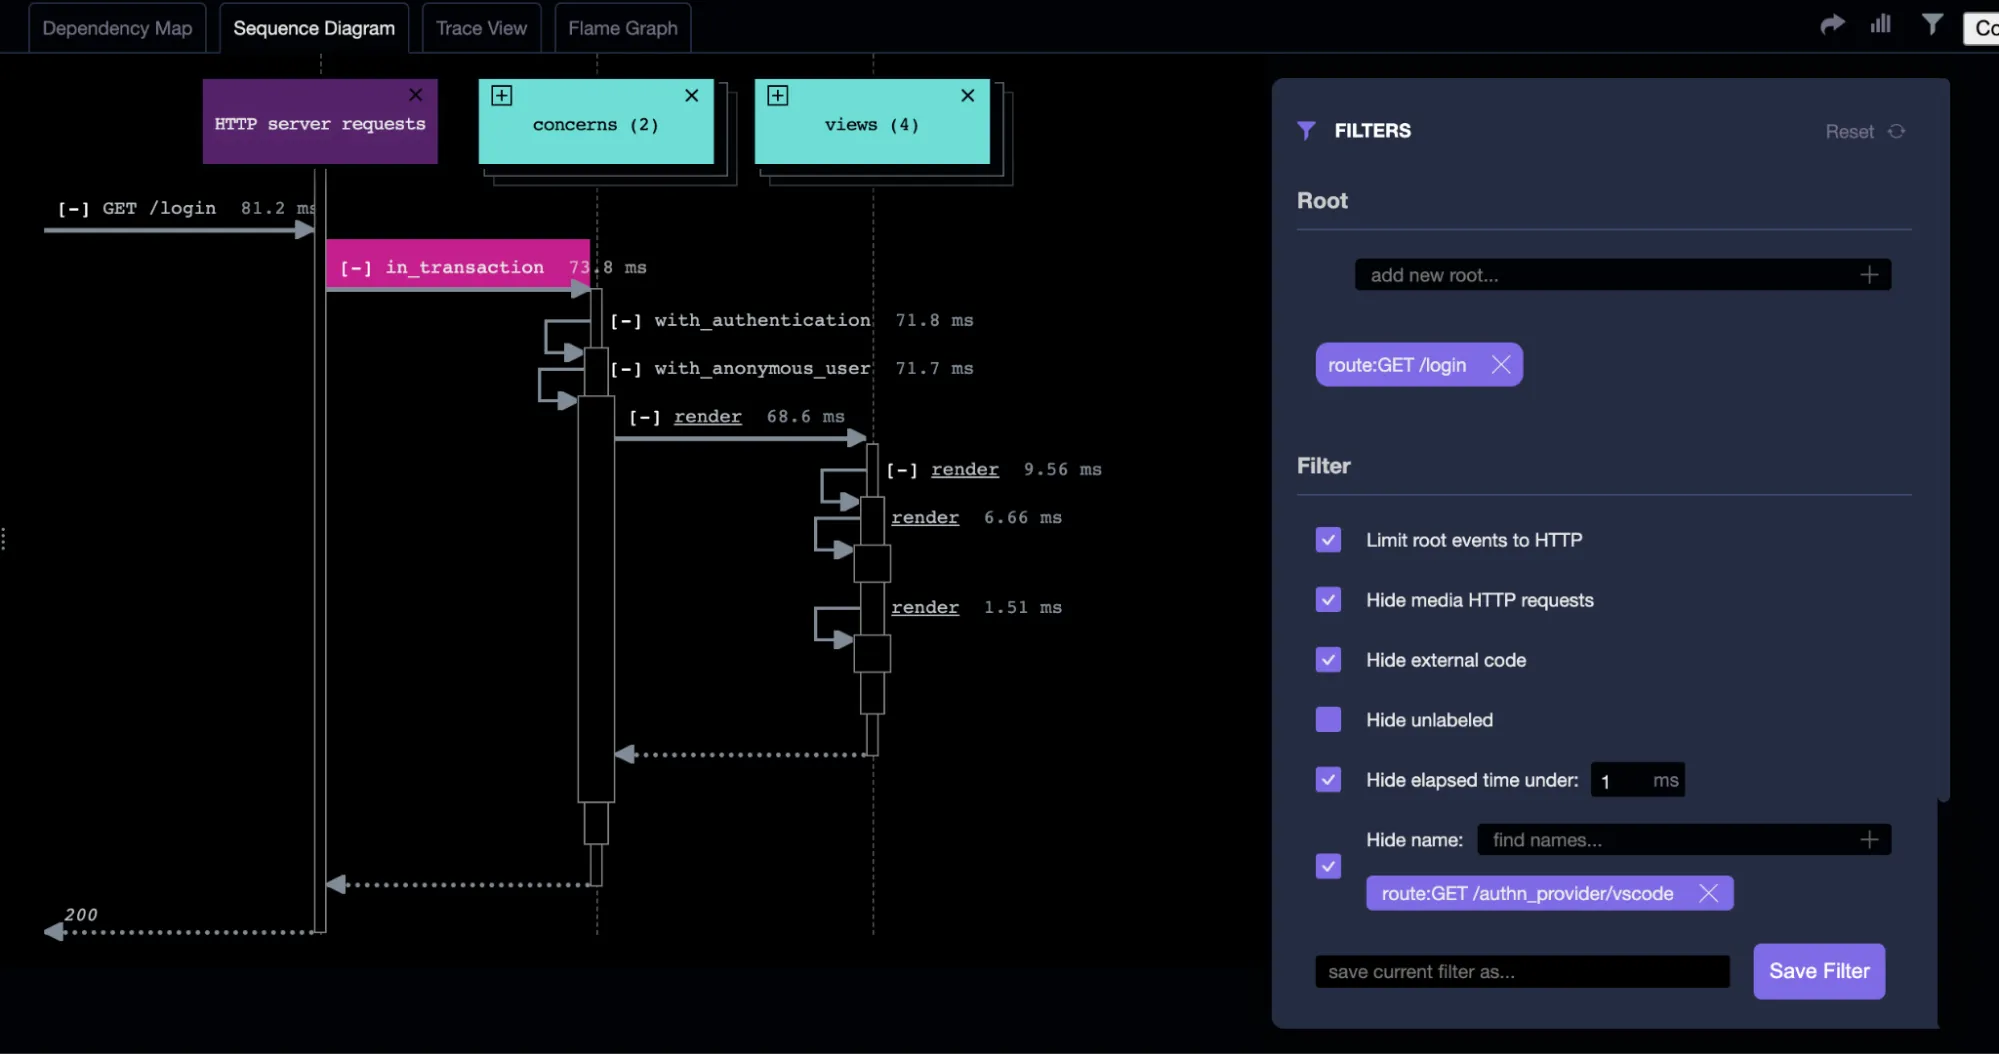
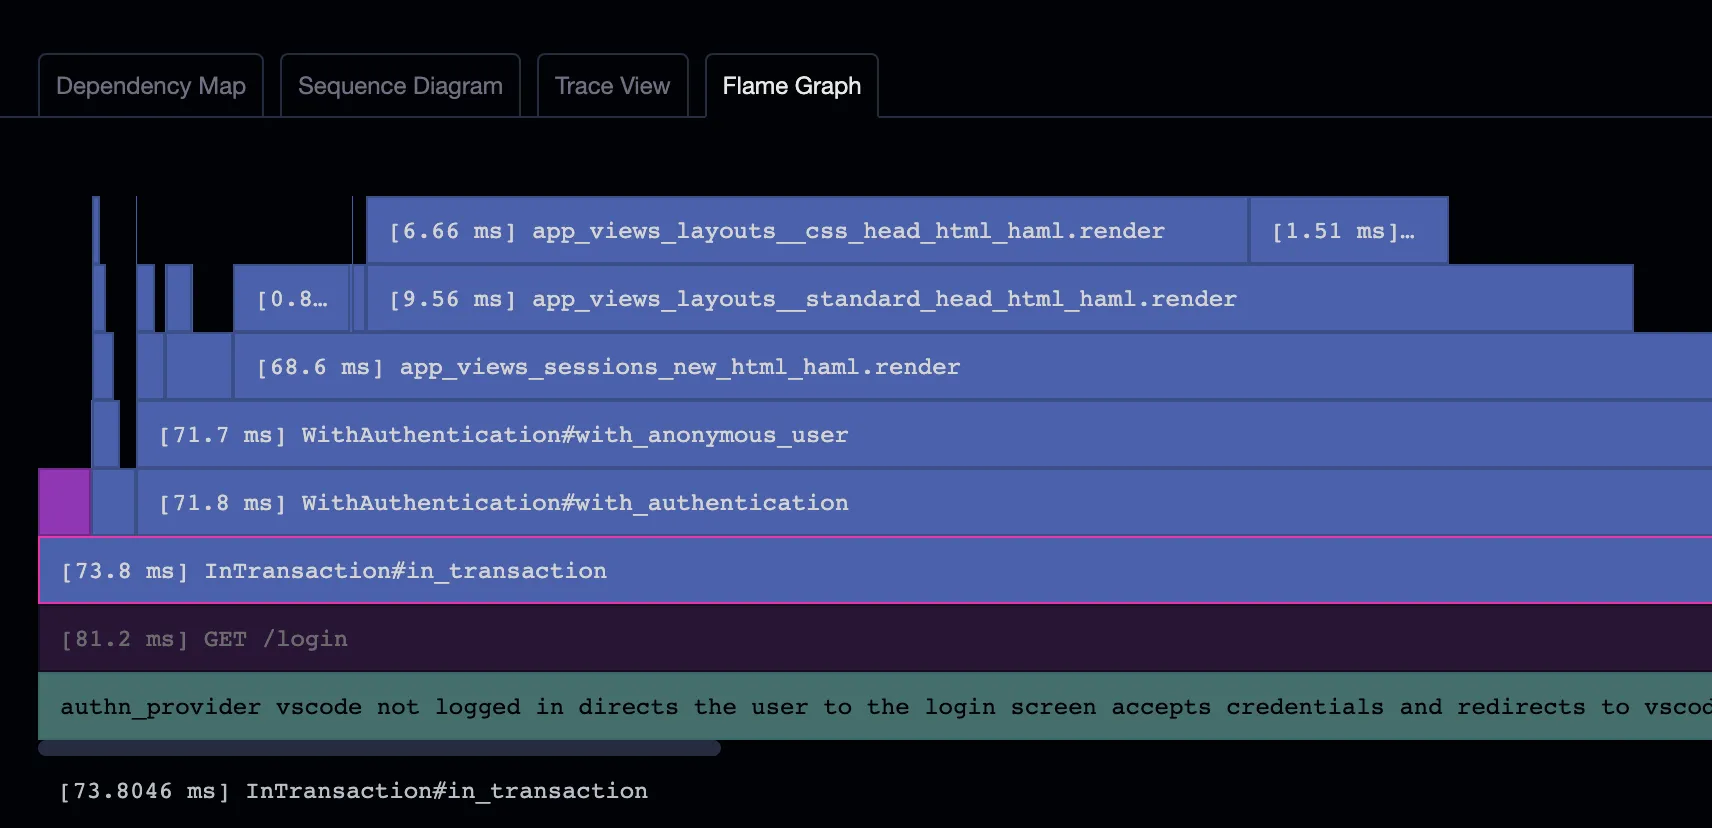
You can also drill into timing data using the Flame Graph view.
Inspect a code object
In the previous section, we covered how to analyze the implementation of an HTTP route. You can do the same thing starting with a function or class.
Expand the Code tree until you find the class or function you’re interested in. When you click on it, you’ll either be taken to the AppMap, or prompted to choose an AppMap.
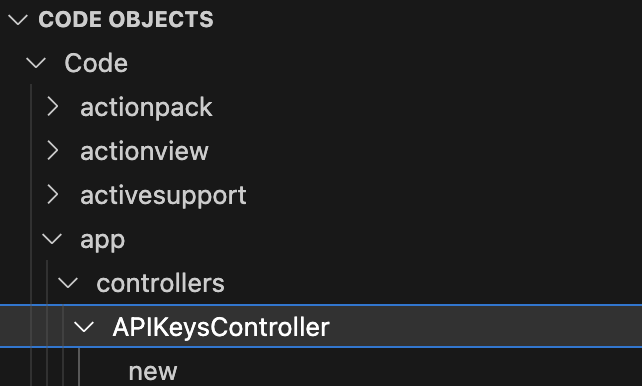
The AppMap will open to the Dependency Map with the function pre-selected. You can click the “Eye” icon to open the event in the Sequence Diagram.

Checklist
- ☐ Open Code Objects view, select an HTTP server request and open the AppMap from it
- ☐ Review the Stats view
- ☐ Declutter by Hiding a function - from the stats view, from the left hand side panel, or by clicking a package X on the sequence diagram
- ☐ Declutter by setting the Root
- ☐ Add a frequent / noisy function to the exclude list in appmap.yml - consult the reference for you language on syntax
- ☐ Try the filter to hide by elapsed time
- ☐ Try the Flame Graph view
Step 4: Share AppMap Diagrams with your team
If you’ve made any more updates to
appmap.yml, be sure and commit the changes to the repo. It’s time to share AppMap with other members of your team!When a new user pulls down your branch, they will automatically inherit the AppMap configuration that you’ve created. So, a new team member only needs to do the following steps in order to start using AppMap:
- ☐ Install AppMap extension for the code editor.
- ☐ Activate AppMap using GitHub or GitLab OAuth. Follow the redirect back to the code editor.
- ☐ Open the install flow to the
Record AppMapstep. There, they can start making their own AppMap Diagrams using any of the supported Recording methods. The work that you’ve done to configure the code paths and exclusions will apply automatically to their installation.
In addition to code paths and exclusions, your team members might want to share AppMap Diagram configuration with each other as well - for example Filter settings.
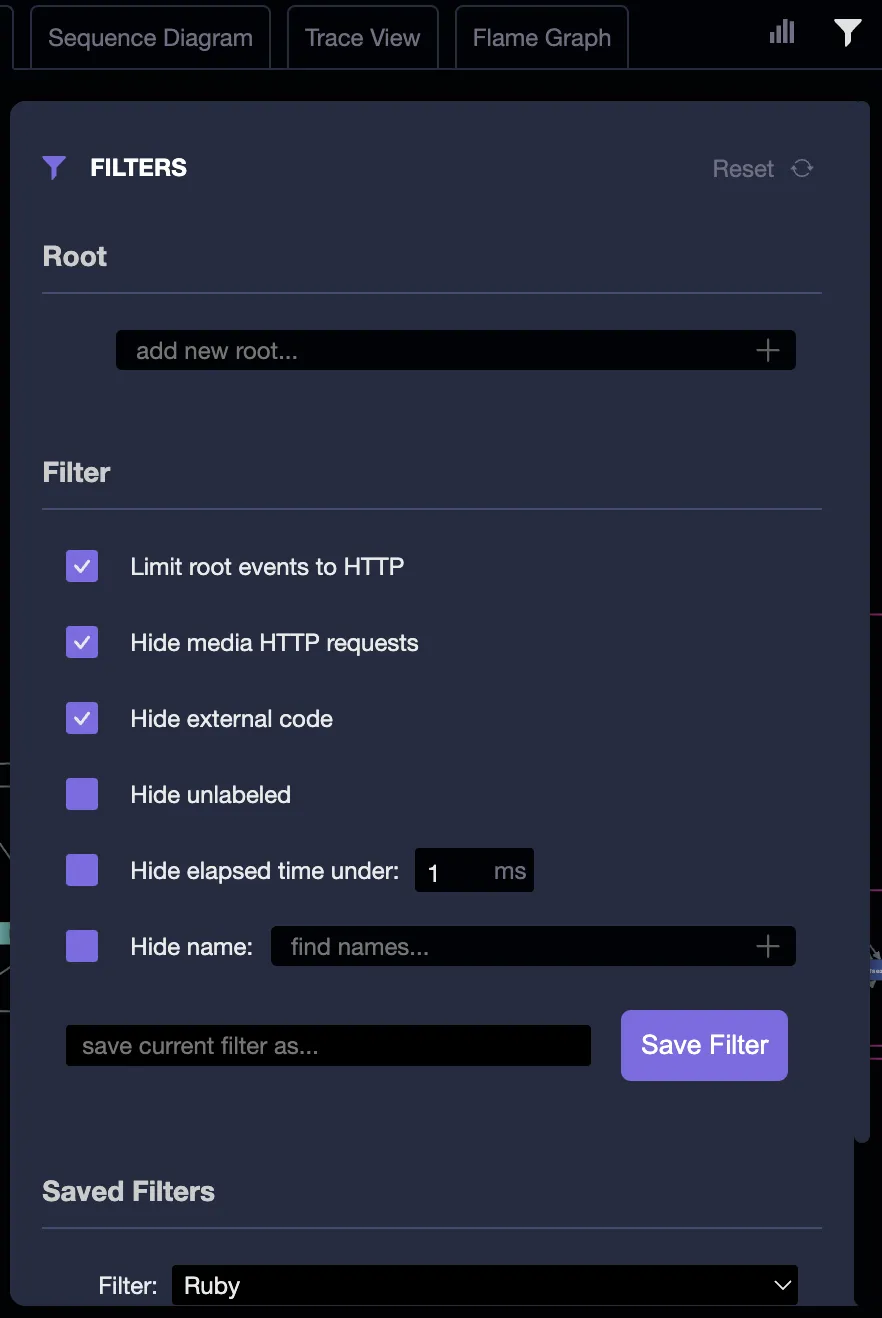
You can use the Saved Filters within your own installation. To share Filter settings with other users, create a new entry in
appmap.ymlcalledfilters. Use the VSCode commandCopy Current AppMap State to Clipboardto place the Filter configuration on your clipboard. It will be a Base64 encoded string - which is just a wrapper around JSON.
Add that filter configuration to
appmap.yml:# appmap.yml filters: my_filter: eyJjdXJyZW50VmlldyI6InZpZXdDb21wb25lbnQiLCJzZWxlY3RlZE9iamVjdCI6ImV2ZW50OjUxMiIsImZpbHRlcnMiOnsiaGlkZUV4dGVybmFsUGF0aHMiOlsidmVuZG9yIiwibm9kZV9tb2R1bGVzIl19fQCommit and push your changes to
appmap.yml.When a user wants to apply that filter to their AppMap, they can copy the filter string out of the
appmap.ymland then run the commandSet AppMap State from Serialized String.
Of course, you can also share filter strings using other channels, like Slack, or store them in a common location such as a Wiki.
Checklist
- ☐ Commit and push changes to appmap.yml
- ☐ Send an AppMap to a colleague - you can send the JSON file via email or chat, they can drag and drop it into their code editor
- ☐ Save Filter settings to the clipboard, then save to appmap.yml or send via chat
Step 5: Automate collection and storage of AppMap Data
Now that the project is configured for AppMap and you’ve decided if you want to ignore any code in the AppMap, it’s time to run AppMap on the full test suite (or, if you prefer, an expanded subset). Doing this will enable you to see how well your app is covered by tests, and understand how you need to augment the tests in order to cover the app fully. You’ll also be ready to take future steps such as:
- Exporting AppMap Diagrams to an external documentation repository.
- Using AppMap Diagrams to troubleshoot a code issue.
- Creating pull request reports using AppMap Analysis.
Note: You can do all these steps in your current branch, or you can merge the
install-appmapbranch and create a new branch calledinstall-appmap-ci. In either case, you don’t have to change the CI configuration on the main/master branch until you’re fully done integrating and evaluating AppMap.To create AppMap Data in CI, you’ll need to confirm that the test command you’re using in your CI job is AppMap-enabled. In Ruby and Python, this is already going to be the case because adding the appmap dependency is all that’s needed. In Java, you need to configure the test command to load the
javaagent. Specific instructions are available for doing this with Maven and Gradle. Confirm that your test command makes AppMap Data locally before pushing it up to CI.Once you’re ready, go ahead and push the branch to kick off a CI run. In the meantime, we’ll work on the next steps for your CI job.
Saving AppMap Data in CI
Once you’ve created AppMap in CI, you don’t want them to disappear when the job ends. AppMap provides tool support for saving AppMap Data as a build artifact.
In GitHub Actions
getappmap/archive-action is a GitHub Action that will save a GitHub Artifact containing all the AppMap Data created in a workflow. To use the archive action, you need to install the AppMap CLI tools, then run the archive-action. It looks like this:
- name: Install AppMap tools
  uses: getappmap/install-action@v1
  with:
    install-appmap-library: false

(run your tests)

- name: Archive AppMap Data
  uses: getappmap/archive-action@v1
  with:
    commit: ${{ github.event.pull_request.base.sha }}
In other CI tools
If you’re using a CI environment other than GitHub Actions, you can use the AppMap CLI tools directly.
Start by downloading the latest @appland/appmap distribution for your platform. The appmap CLI includes an
archivecommand, which performs the following steps:- Updates all index files associated with the AppMap Data
- Generates a sequence diagram file of each AppMap
- Runs the AppMap scanner to identify performance and security flaws.
- Generates OpenAPI definitions of the project.
- Stores all this data, along with identifying metadata, in a TAR file. The TAR file contains a gzipped TAR of the AppMap Data.
You can then store this archive anywhere you keep large files. The
appmap restorecommand can be used to expand this archive back into individual AppMap files, along with the indexes, sequence diagram files, findings, and OpenAPI definitions.So, once the AppMap Data is created by the CI job, run
appmap archiveto create an AppMap archive file. You can save this archive file to the artifact store of your CI provider.Checklist
- ☐ Enable AppMap in CI
- ☐ Run a build job to create AppMap Data
- ☐ Run the
appmap archivecommand to save AppMap Data - ☐ Store the archive in the CI server as a build artifact
Step 6: Use AppMap Diagrams to investigate a code issue
At this point, you have archives of AppMap Data for different versions of your code, and you can restore those archives into your code editor to use the AppMap extension to investigate any type of code problem.
Let’s take a deeper dive into how that works. Suppose your team has recently deployed new code, and you’re getting an alarm from the production monitoring system. There is a web route that’s performing badly, a SQL query that’s running slow, or an exception that keeps being raised and disrupting user sessions.
- Obtain the archive for the affected version of the code
- Find the problematic query, exception or route in the code objects view
- Investigate the scenarios in which this code is used
- Take a look at which code paths have been tested in CI, and which haven’t been tested. This can help you to reproduce the problem locally
- For SQL, identify where in the code the query is being issued. This can be difficult when queries are generated by ORM. AppMap makes it easy to figure this out.
Obtain the archive
Note If you don’t have saved archives yet, you can build AppMap Data for troubleshooting using remote recording or requests recording. This section shows how restoring AppMap archives can enable you to skip that step and get right to code investigation.
Once you’ve integrated AppMap with CI, you’ll have a saved AppMap archive for each version of the code that’s been merged to the main branch. So your first troubleshooting step is to determine which version of the code is affected. Then you can obtain the AppMap archive for that version of the code.
You can use the AppMap
restorecommand to expand the AppMap archive into your local, working environment. Copy the archive file into the project directory.appmap/archive/full/<revision>.tar. Then run the restore command to unpack it:appmap restore --revision <revision> --exact --output-dir tmp/appmapNow the AppMap Data are unpacked into the
tmp/appmapdirectory and they will be detected and listed by the AppMap extension in your code editor. You can use all the techniques described in the Use AppMap Diagrams section to investigate the problem.Checklist
- ☐ Download an AppMap archive from CI server
- ☐ Use appmap restore to unpack the archive
- ☐ Open the AppMap Diagram in your code editor
- ☐ Open the Code Objects view to find AppMap Diagrams for a particular HTTP route, SQL query or function.
Step 7: Improve application coverage
You probably have some idea of the test coverage of your application from applying a dedicated code coverage tool. These types of tools will tell you whether you have code that is completely uncovered by tests. But AppMap goes beyond that, to tell you:
- Whether different operational scenarios are covered for a function.
- Which parts of your web services API are actually exercised. How your application interacts with external services and the database.
The Code Objects view is a good starting point for doing this investigation. You’re looking for:
- How well do the HTTP routes listed in the Code Objects view cover the known API of the application?
- Is there functionality that the application is known to have, which is not reflected in these HTTP routes? If so, there is no test coverage of those routes that actually traverses through the web stack.
Similarly, with SQL. The Code Objects view provides the inventory of known SQL queries. If there is known code behavior that’s NOT reflected in the Code Objects view, then test coverage that actually exercises the SQL is lacking.
When the web stack or SQL queries are not exercised by the test suite, the application is at much higher risk of production security, stability, and performance problems. It’s also very difficult to know how a code change will affect the application when it’s deployed, because a simple code change might turn out to affect many different API routes - or none at all…
- Compare with known OpenAPI
- Compare with known SQL
- Compare with known code inventory
Next Steps - AppMap analysis
Thus far, we’ve shown how to build, maintain and use AppMap archives to investigate, learn and fix code. The next step with AppMap is to use AppMap in CI to analyze each Pull Request. Request access to our AppMap in CI solution.
Thank you for your feedback!
