-
Docs
-
AppMap for Visual Studio Code
- Settings
- AppMap panel
- “Run with AppMap” for Java
- Extension actions
- Remote recording
- Integration with GitHub Codespaces
- Generate OpenAPI Definitions
- GitHub repository
Settings
Copilot Language Model
GitHub Copilot supports a variety of different language models. Use the VS Code command “AppMap: Select Copilot Model” in the command palette.
To open the Command Palette.
You can use a hotkey to open the VS Code Command Palette
- Mac:
Cmd + Shift + P - Windows/Linux:
Ctrl + Shift + P
Search for
AppMap: Select Copilot Modelin the command palette.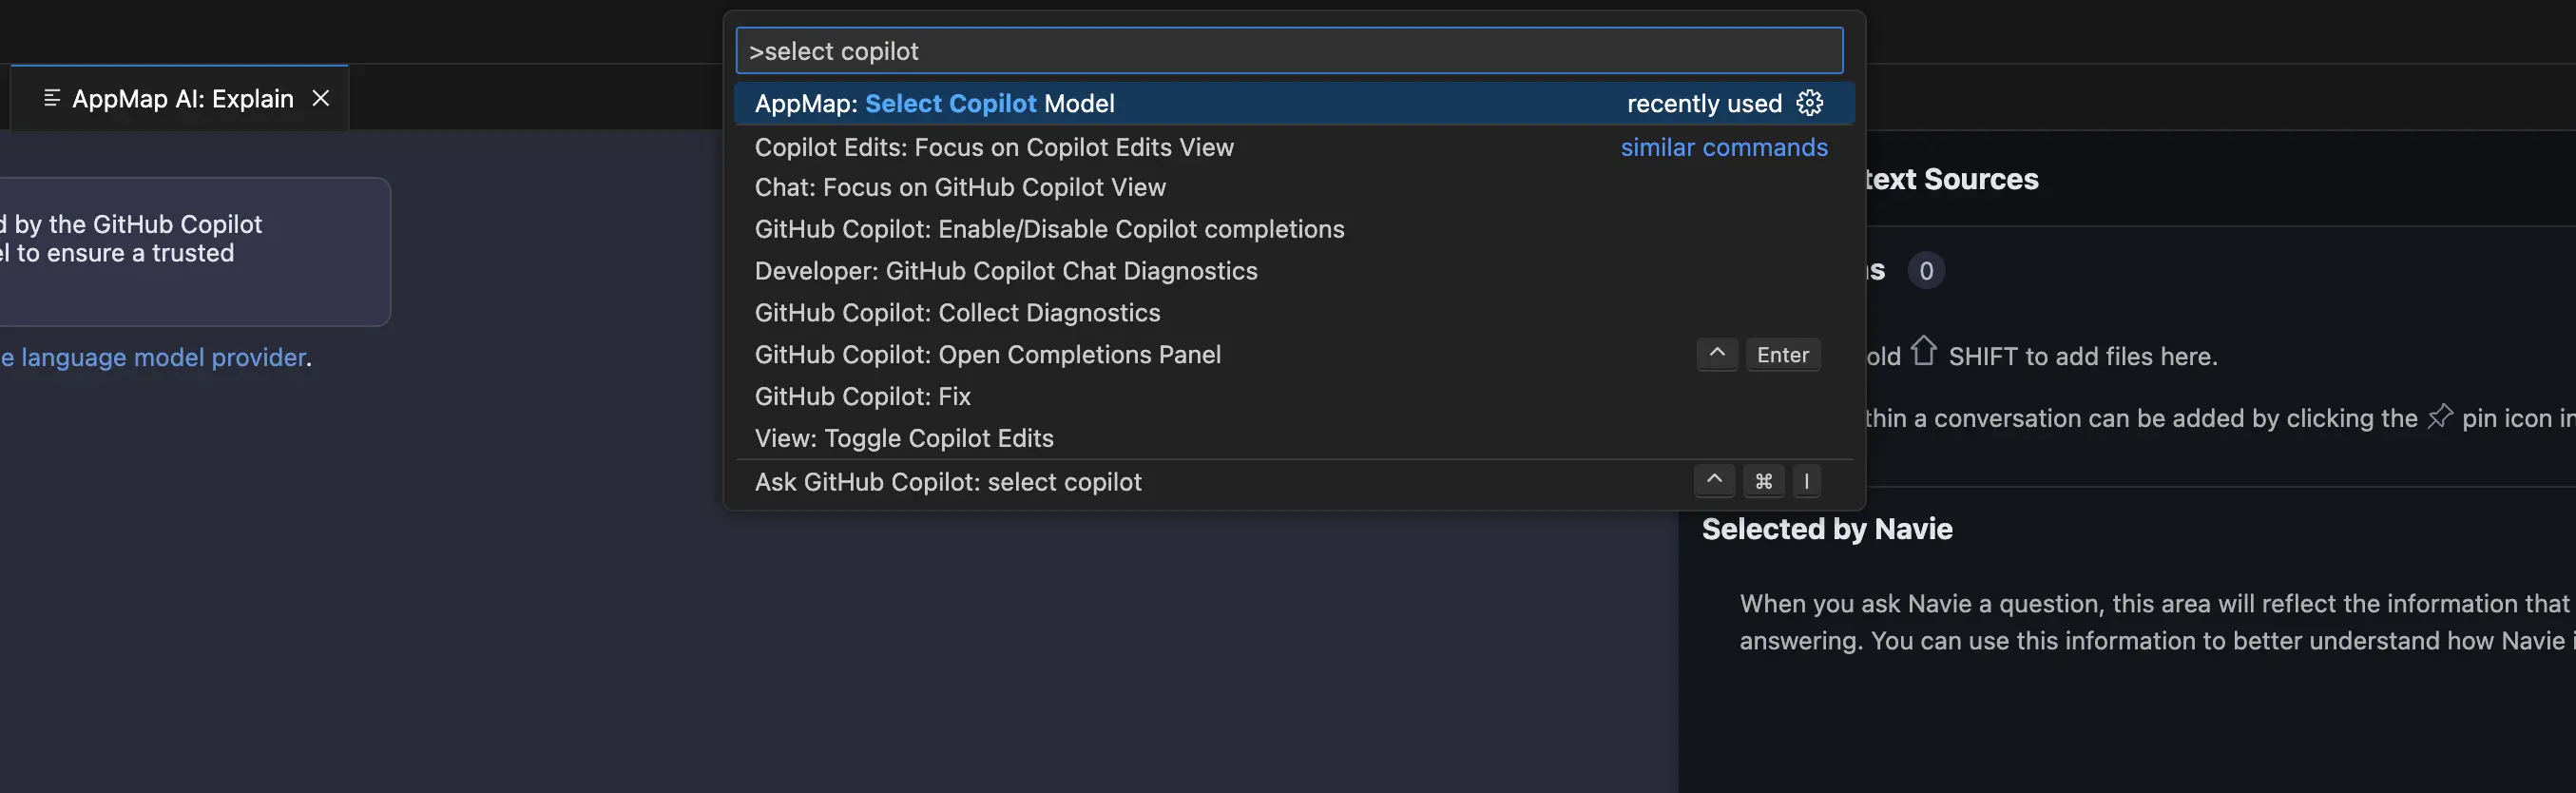
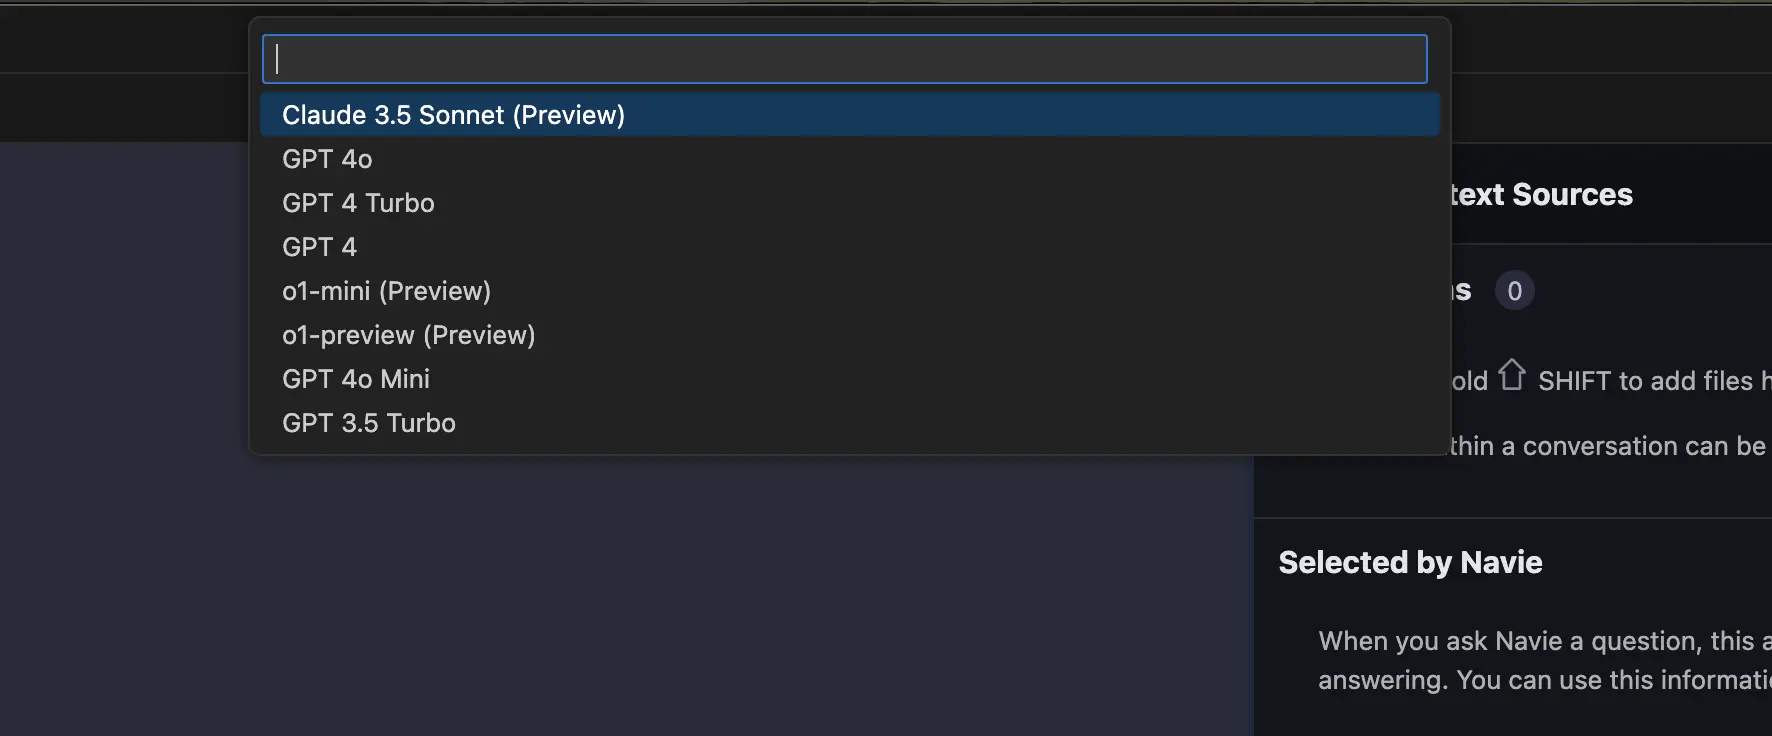
Then select the specific model you’d like to use with AppMap Navie
Video Demo
LLM Key Settings
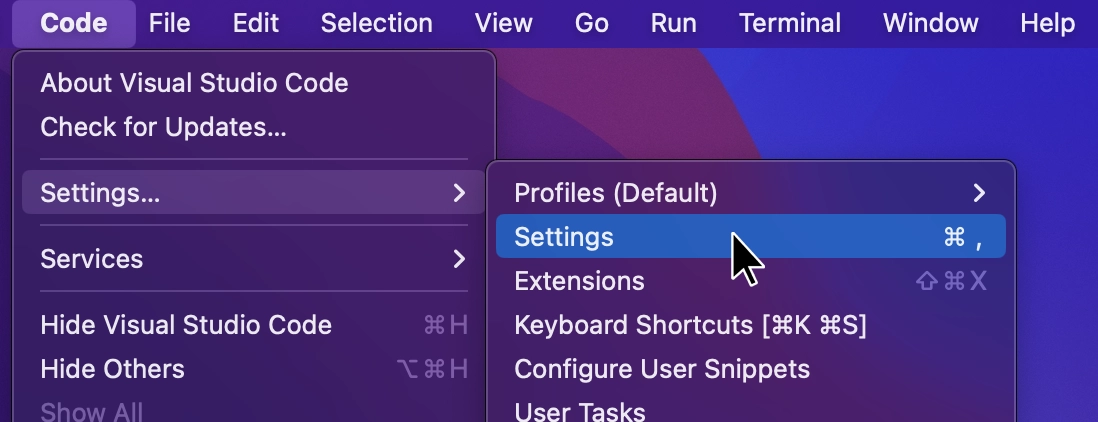
In VS Code, go to settings.
Search for “appmap environment” to reveal “AppMap: Command Line Environment” setting.
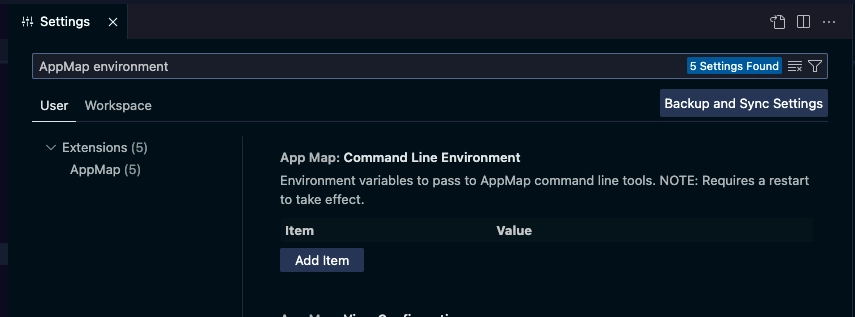
Use Add Item to define the relevant environment variables according to the LLM Configuration instructions.
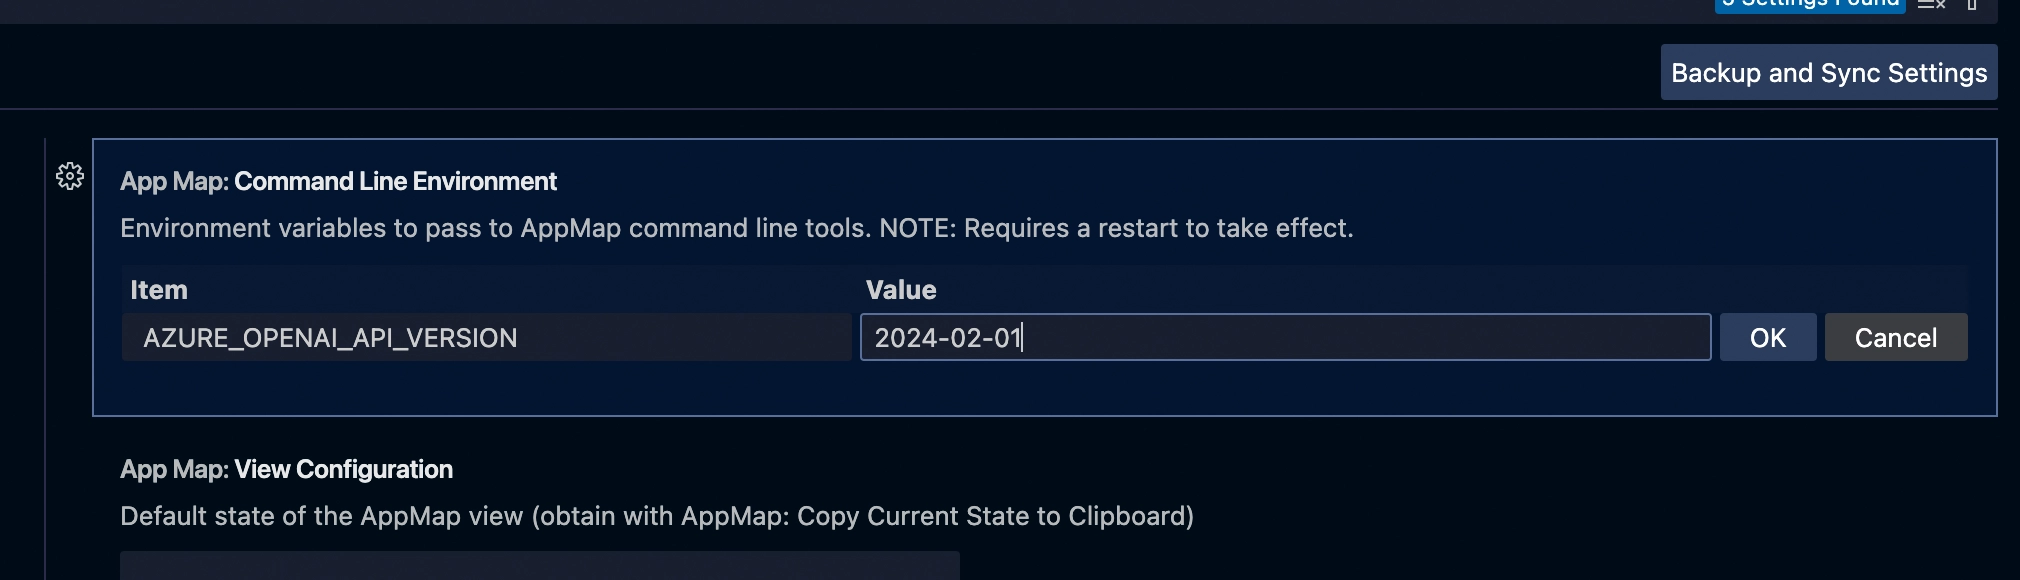
Reload your VS Code for the changes to take effect.
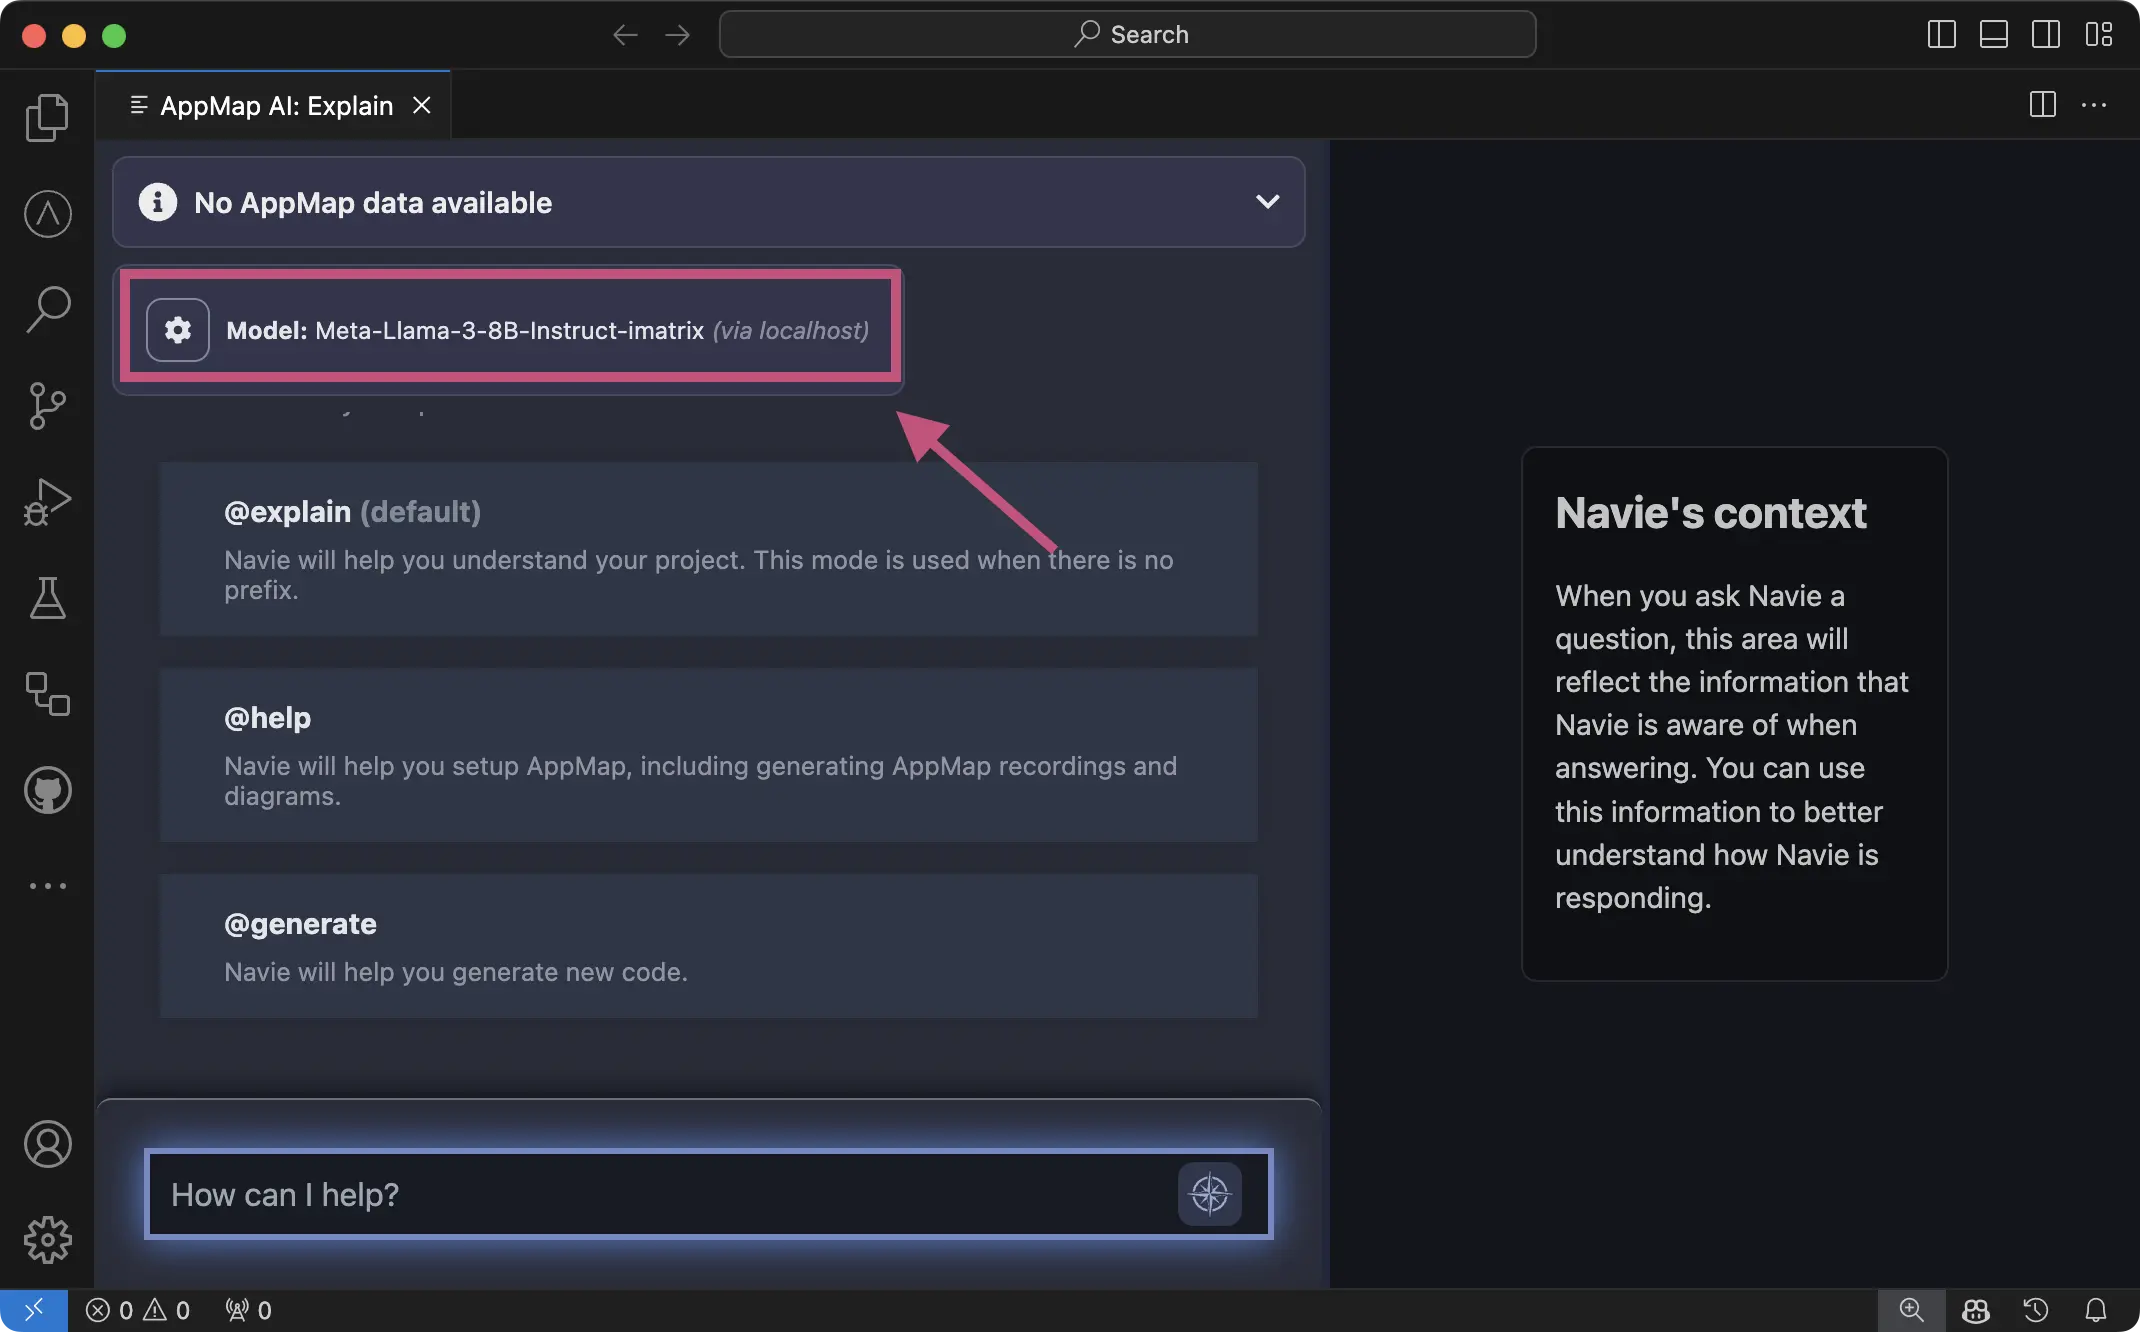
After reloading you can confirm the model is configured correctly in the Navie Chat window.
AppMap panel
Instructions
Step-by-step instructions for configuring a project to use AppMap and using the main features.
Once you’ve configured AppMap for a project, commit the file changes to Git so that your colleagues don’t have to do the setup themselves.
AppMap Diagram tree view
The AppMap view shows all AppMap Diagrams in your open projects. You can open it from the top level menu (View -> Open view… -> AppMap), with an AppMap action or by clicking on its icon in the side bar.
AppMap Diagrams are organized by how they were created (request recording, remote recording, test case recording).
Within the AppMap tree view you can
- Click on any AppMap name to open the diagram
- Right-click for a context menu
You can also use the tree view buttons to Filter the AppMap tree by name, or search for a specific AppMap. There are also extension commands to do this.
Runtime Analysis
AppMap can find automatically find software design flaws that impact security, performance, stability, and maintainability. When a problem is found, it’s listed here. Click on the problem to get detailed information about it.
Code Objects
All the HTTP server requests, SQL queries, packages, classes, and functions that are present in an AppMap are listed here in a tree view. You can navigate through these code objects to see what’s present in your project. Click on any code object to open the AppMap Diagram that contains it.
“Run with AppMap” for Java
This section only applies to Java applications.Installing the AppMap VC Code plugin adds a default Launch Configuration which supports the integrated VS Code debugger. These can be used to run your Java application code with AppMap automatically configured, saving you from manually changing your Maven or Gradle settings. This is the recommended approach for all Java users using the VS Code editor.
To run your tests with AppMap enabled, navigate to the
Testingsection of VS Code in the left hand menu icons. If your project has tests you will see them listed in the following screen. From here, click on theRun Testsicon, highlighted in the screenshot below. This will kick off your test cases with the AppMap libraries installed and enabled.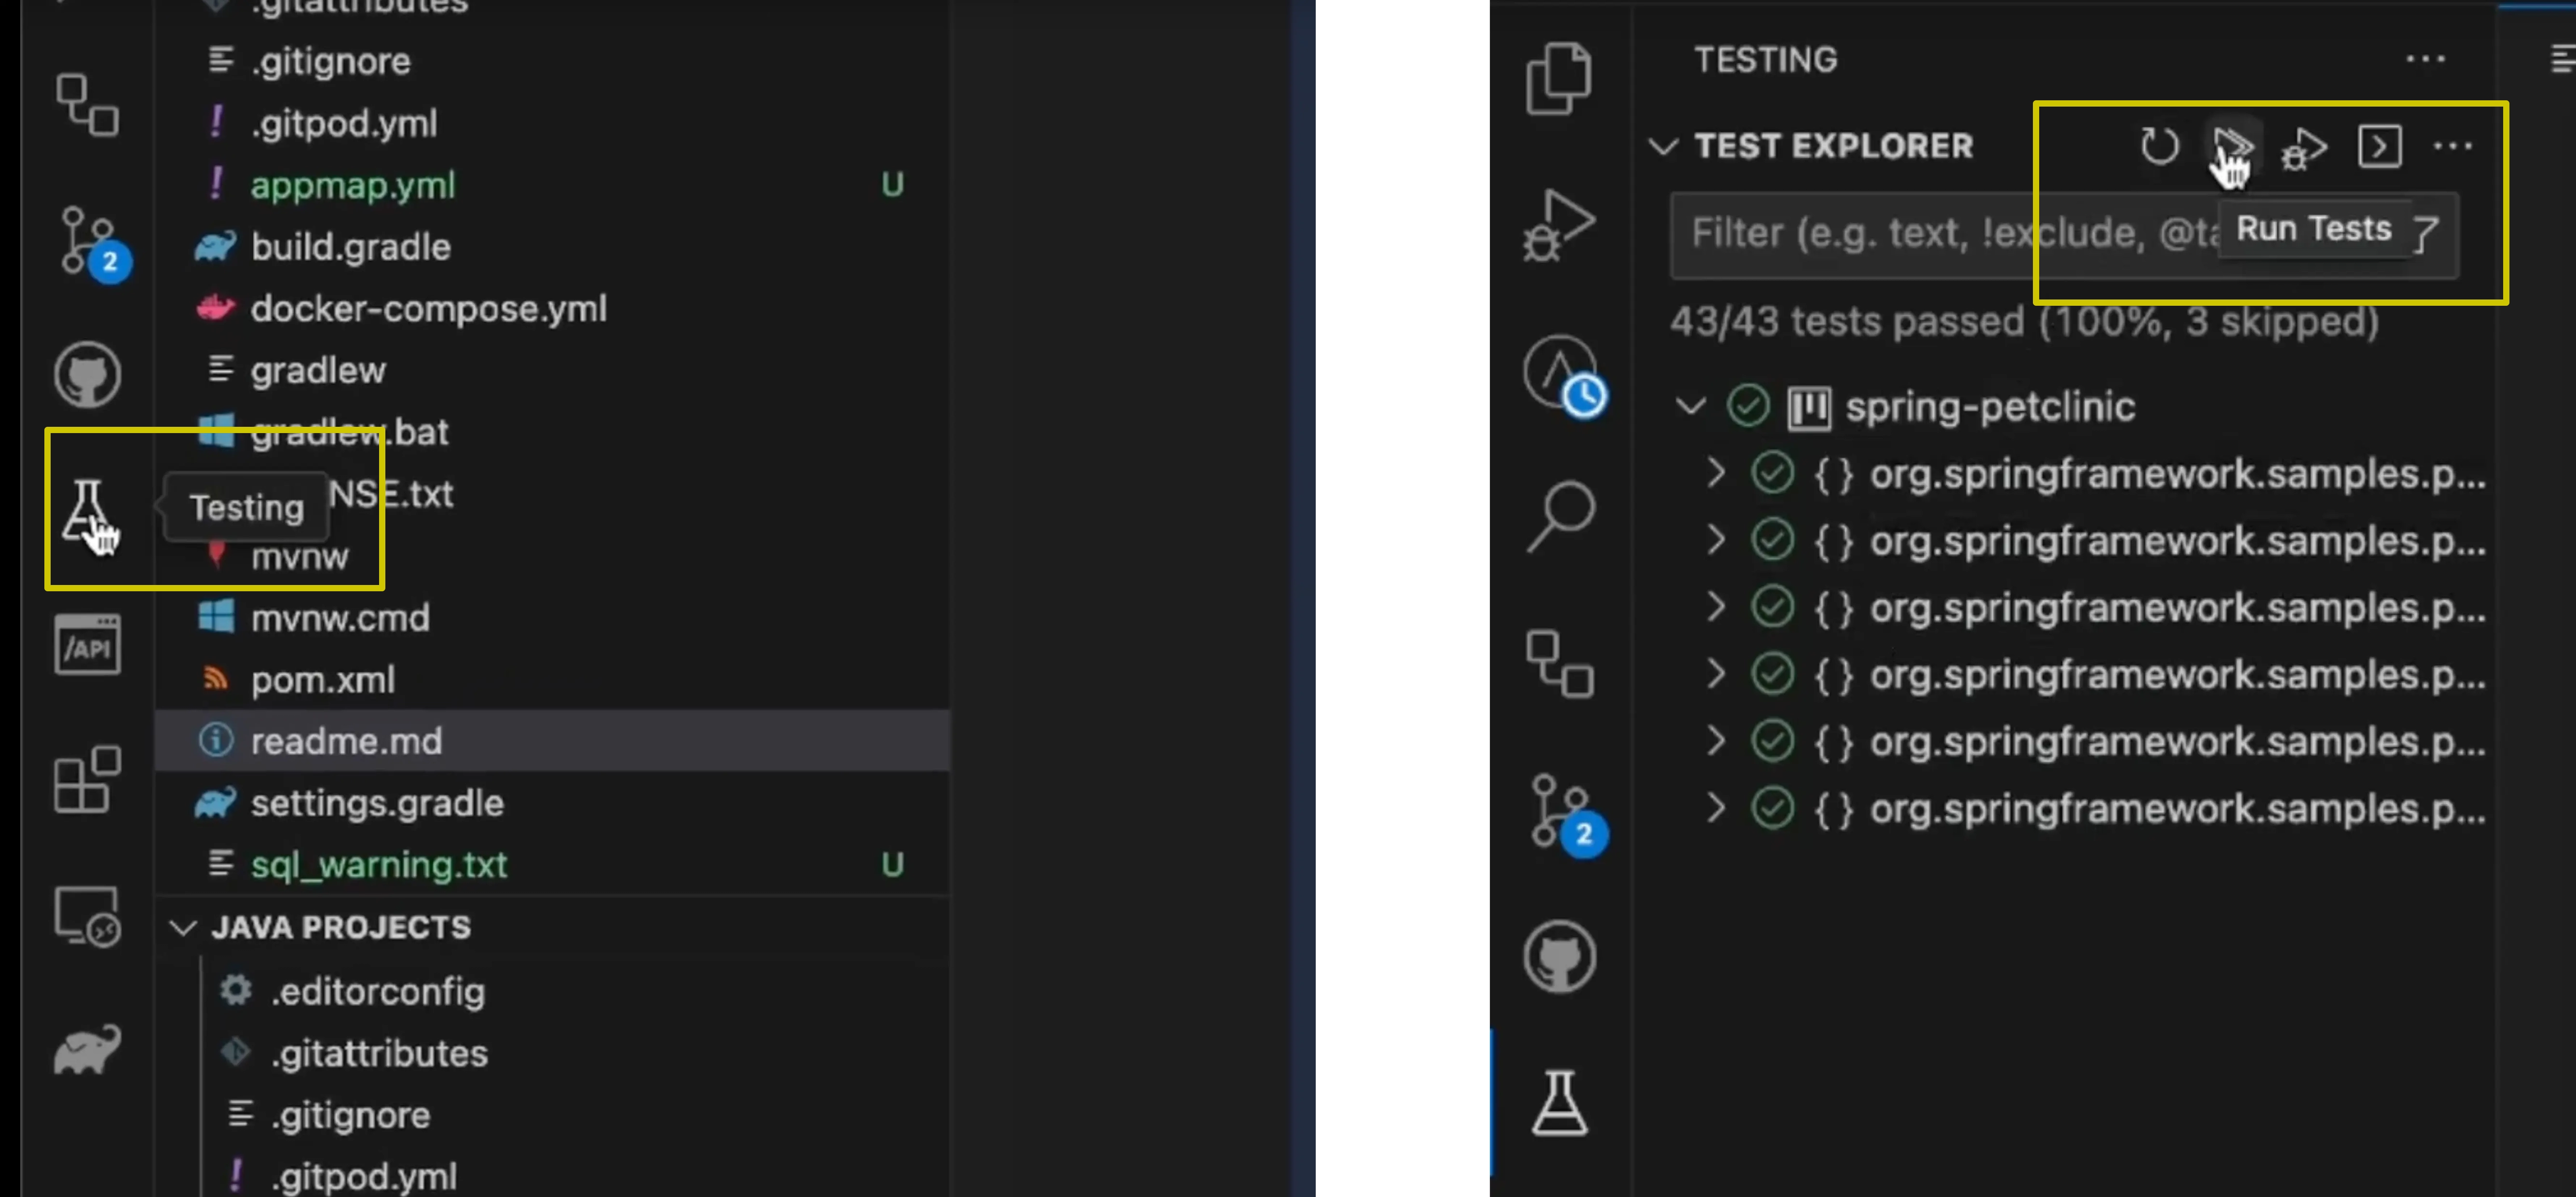
To run your application with AppMap enabled, navigate to the
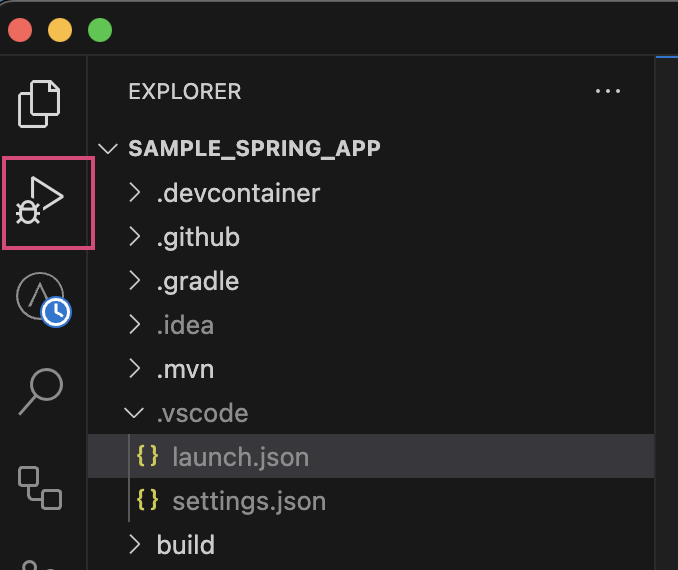
Run and Debugsection of VS Code in the left hand menu icons. You will see a new launch configuration in the in the drop down which saysRun with AppMapalongside any other launch configurations for your project. With theRun with AppMaplaunch configuration select click on the “Play” icon, highlighted in the screenshot below. This will start your application with the AppMap libraries installed and enabled. You can now interact with your application to generate request recordings or use remote recording.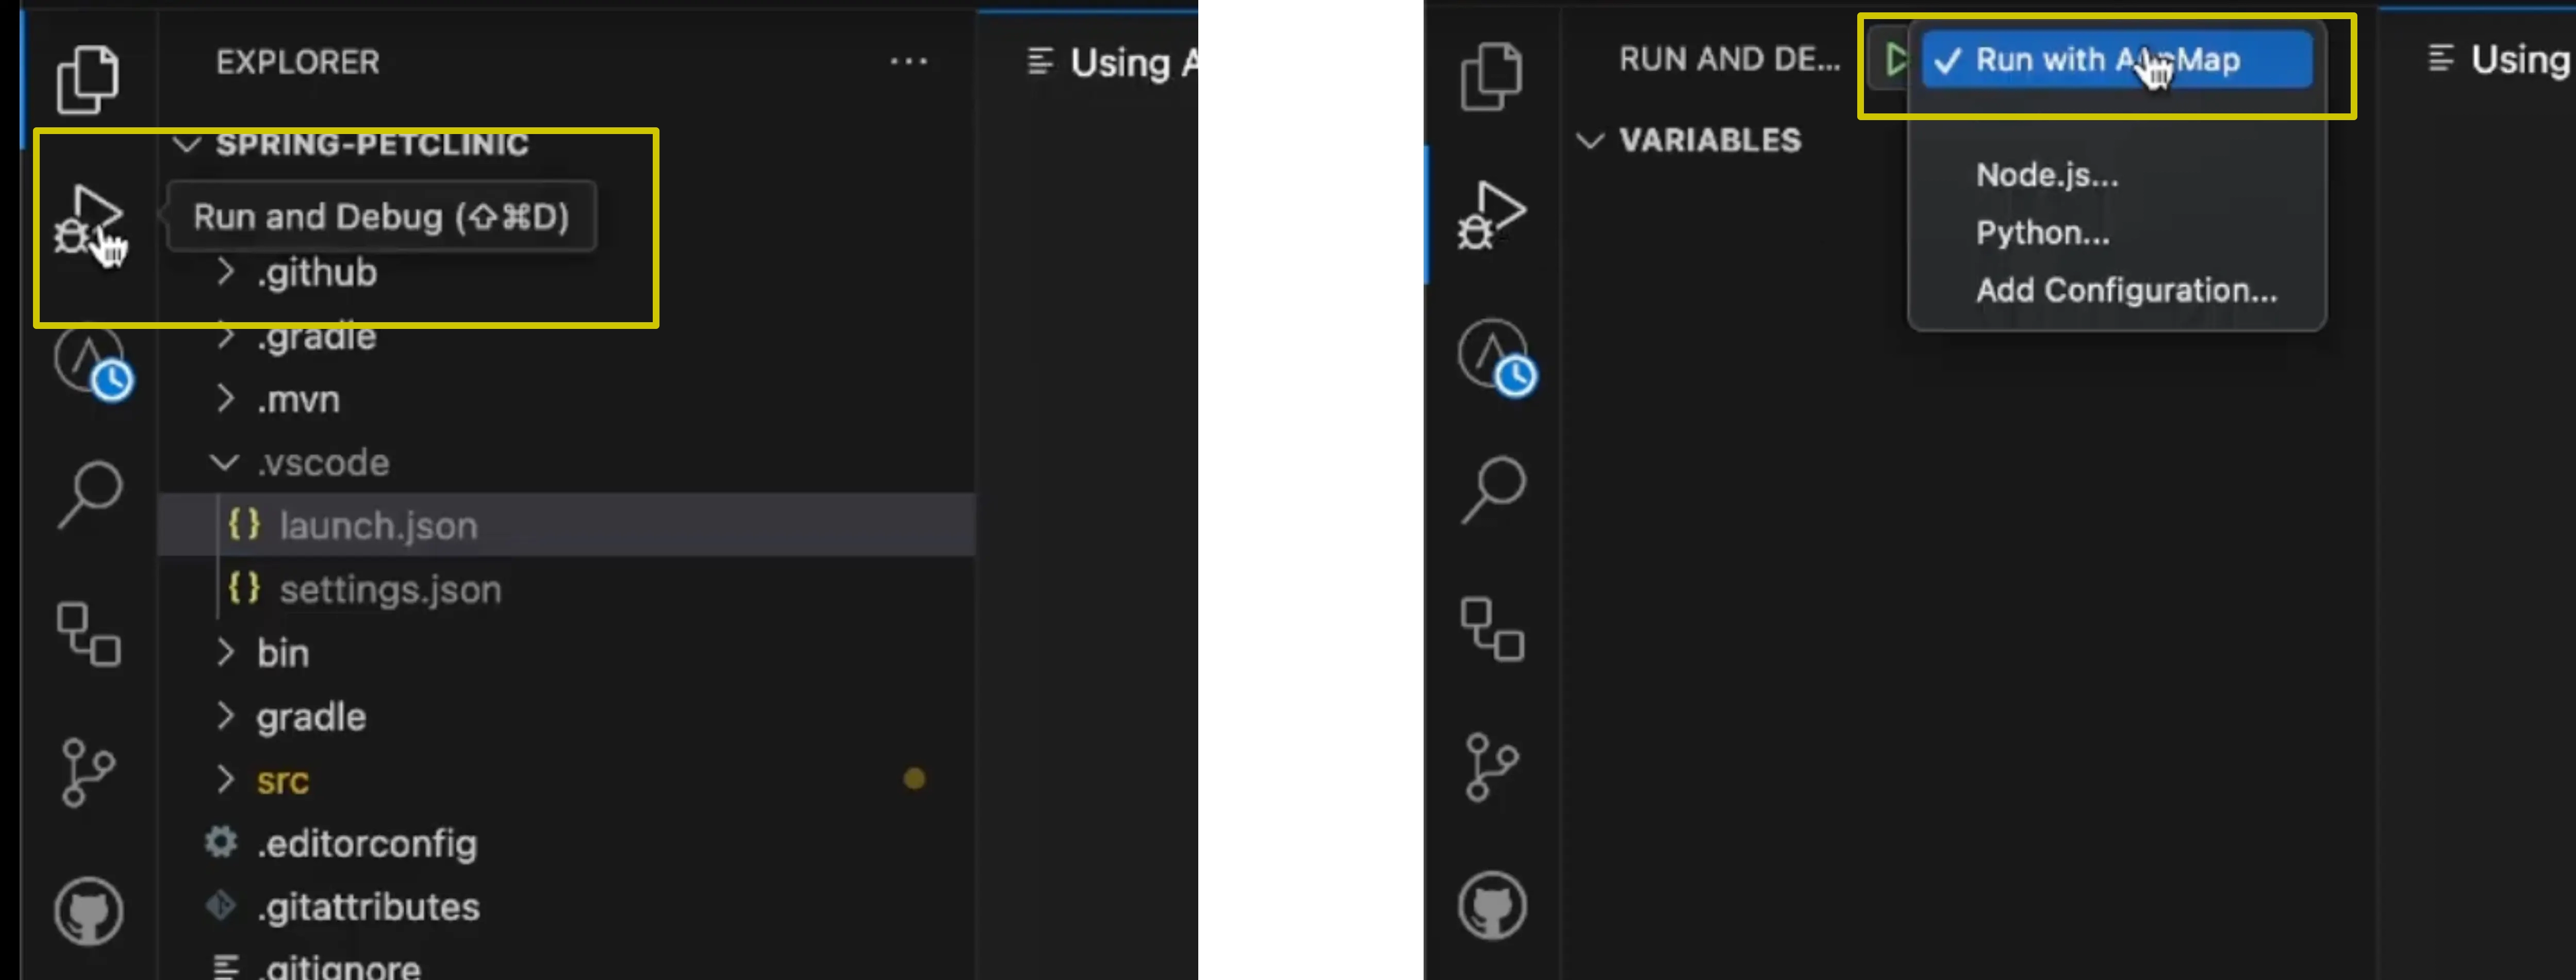
After installing the VS Code AppMap extension for your Java project, you will notice a new launch configuration in the
.vscodedirectory in your project.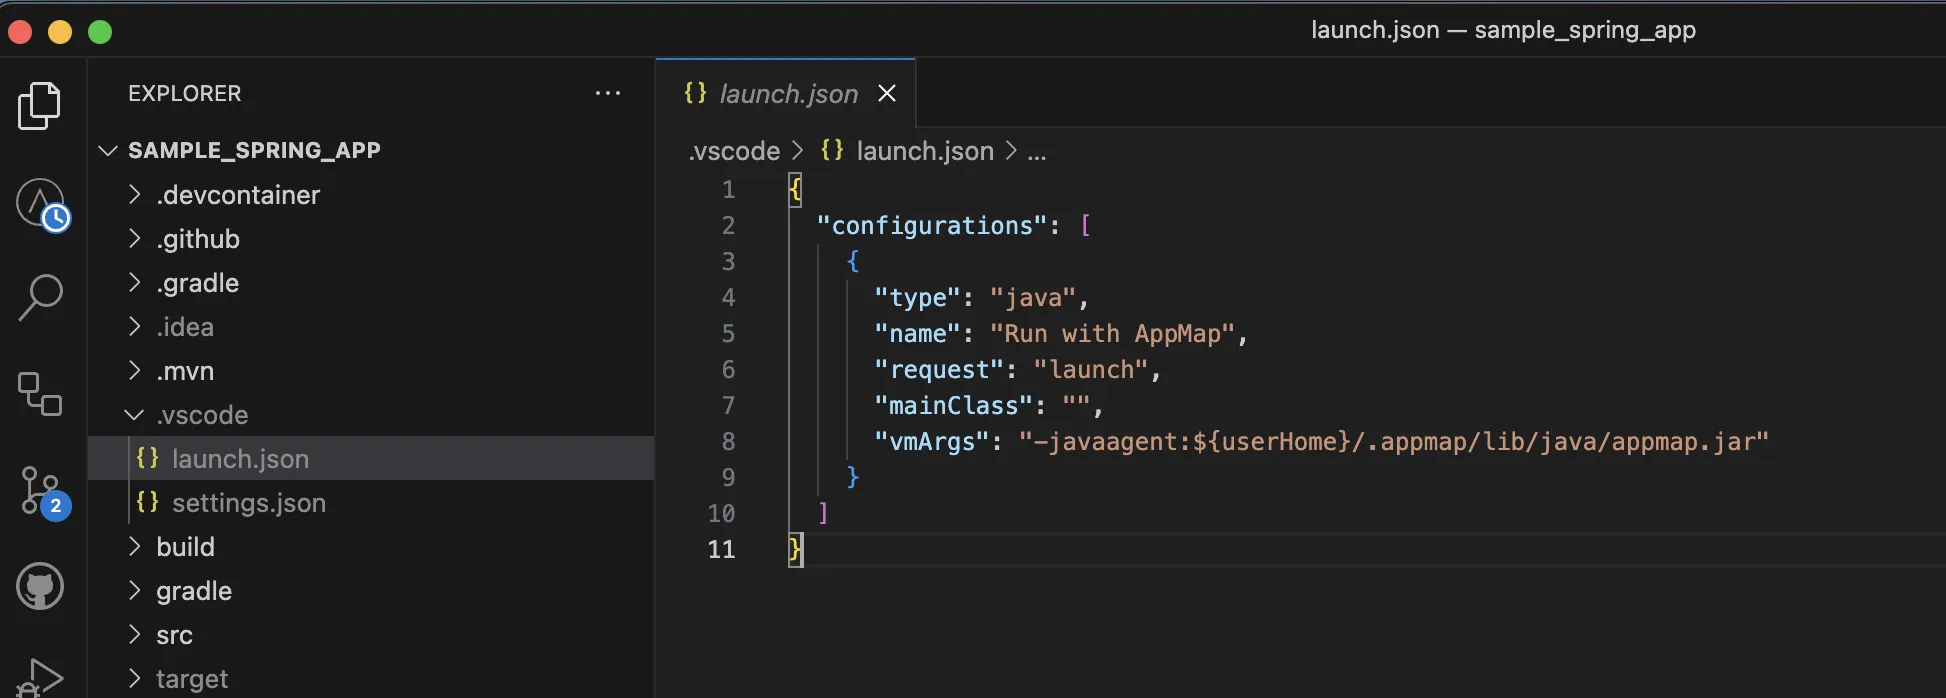
Next, click on the “Run and Debug” menu option in the left hand column of VS Code
Clicking on the “Play” button next to the “Run with AppMap” launch configuration will start your Java application with the necessary AppMap configuration flags enabled by default.
When your application is running you can proceed to record AppMap Data using either Requests Recording or Remote Recording
Extension actions
To open the list of AppMap extension actions, press
CTRL+SHIFT+PorCOMMAND+SHIFT+Pon macOS and typeAppMap.Most of the command names should be self-explanatory. Here are a few commands which are a bit more complicated:
- AppMap: Review Your Code Starts a code review using AppMap Navie. This command analyzes your code changes and provides a comprehensive report to help you improve code quality, security, and performance by providing specific, actionable suggestions.
- AppMap: Filter/Find AppMap by name Opens the AppMap side bar view and the filter/find text field
-
AppMap: Login, AppMap: Logout Some extension functionality requires you to login to the AppMap Server. You’ll be prompted to do this when you setup AppMap for the first time. You can also login and logout using the built-in
Accountsfeature of VSCode. -
AppMap: Touch Out-of-Date Test Files If you have AppMap Diagrams generated from test cases, this command will determine which tests need to be re-run in order to bring the AppMap Data up-to-date. It will then “touch” (update the modified date) of each out-of-date test case. You can use a file watching trigger program like
Guard(Ruby),gruntorgulp(JS) to re-run the test cases as they are touched. - AppMap: Copy Out-of-Date Tests to Clipboard Similar to the “Touch Out-of-Date Test Files” command, but places the file names on the clipboard
- AppMap: Open Code Object in AppMap Using this command you can find and open AppMap Diagrams for any code object (package, class, function, route, etc) in your project.
Remote recording
You can make a remote recording from within the VSCode IDE. First, start your application with remote recording enabled. Exactly how to do this depends the language you’re using - consult the agent reference for details.
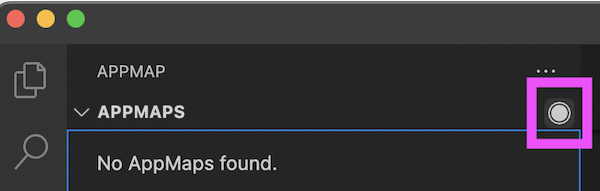
To start a recording, click the remote recording button, or use the command AppMap: Start a Remote Recording.
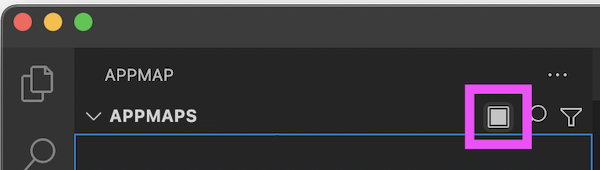
Interact with your app through its UI or API. Then use the stop remote recording button again, or use the command AppMap: Stop the Remote Recording.
You’ll be prompted to save the AppMap to a file, and it will be opened.

For more details about remote recording, see:
Integration with GitHub Codespaces
AppMap for VS Code supports GitHub Codespaces or other remote development environments. Currently AppMap only supports GitHub Codespaces natively in the VS Code Editor and not in the GitHub Web Based editor.
Learn more about AppMap in GitHub Codespaces:
Generate OpenAPI Definitions
After recording AppMap Data for your project, open the command palette using
CTRL+SHIFT+PorCOMMAND+SHIFT+Pon macOS, typeAppMap: Generate OpenAPI, then hitEnter. This will open a new file with your OpenAPI definition document. Save this file locally, share with your team, or ingest as a new collection into API tools like Postman.
GitHub repository
https://github.com/getappmap/vscode-appland
Troubleshooting
If you encounter issues with the AppMap VS Code extension, particularly during startup, please check the Output panel (
View -> Output, select “AppMap: Services”) for error messages. Common startup issues and their solutions are documented in our troubleshooting guide.
Thank you for your feedback!
