-
Docs
-
Accessing Navie Logs
Visual Studio Code
You can access the Navie logs in VS Code by opening the
Outputtab and selectingAppMap Servicesfrom the list of available output logs.To open the Output window, on the menu bar, choose View > Output, or in Windows press
Ctrl+Shift+Uor in Mac useShift+Command+U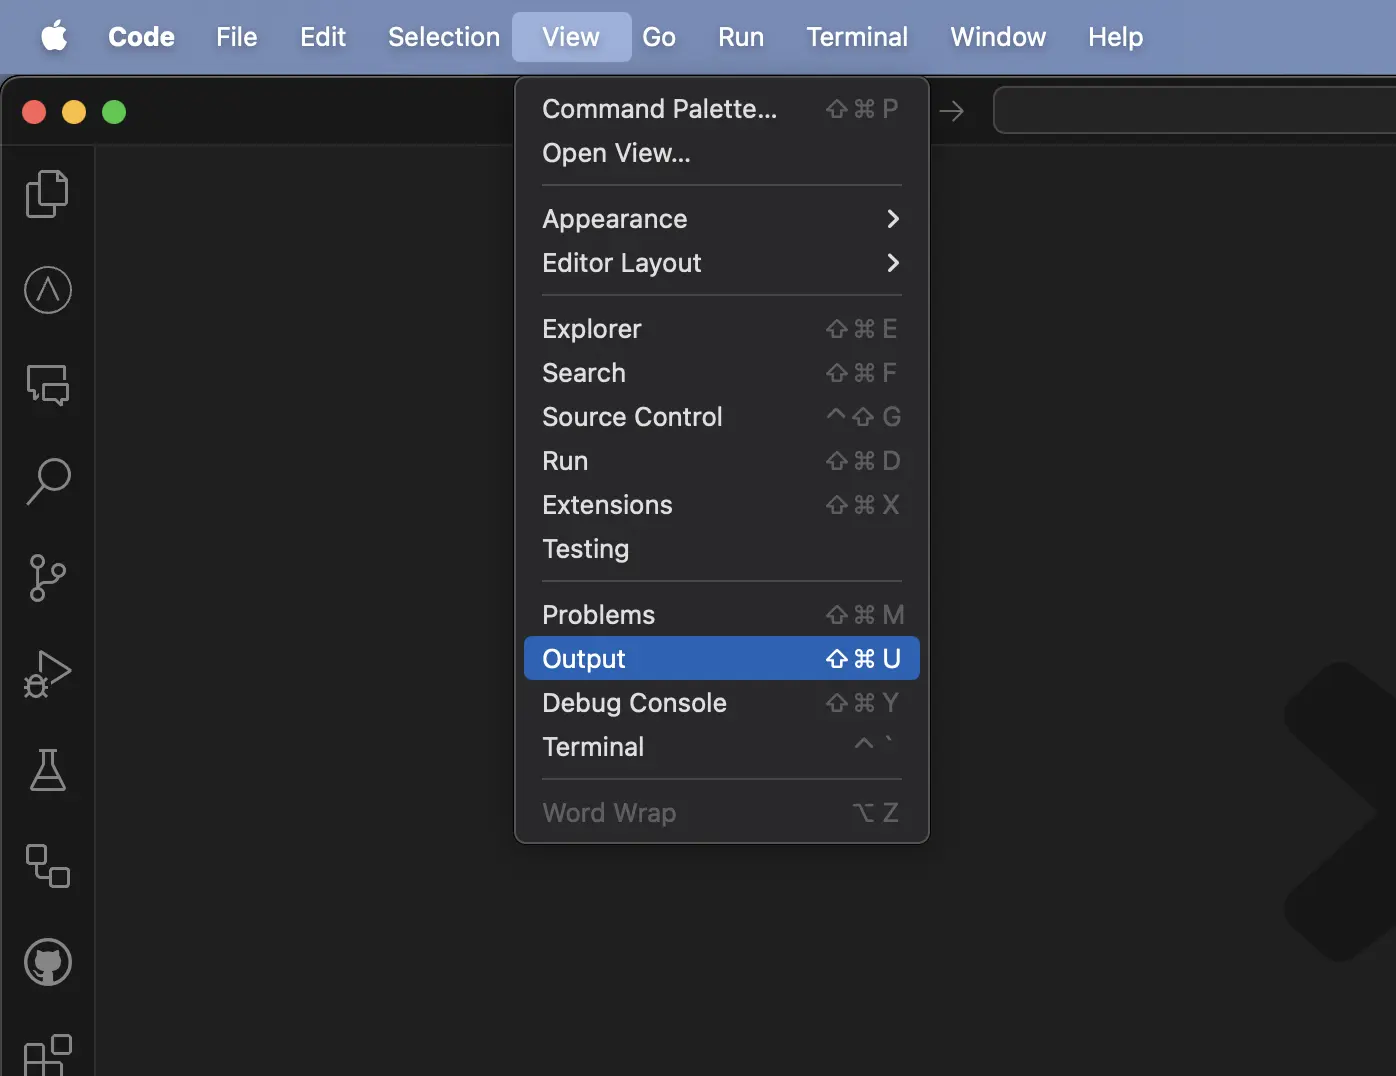
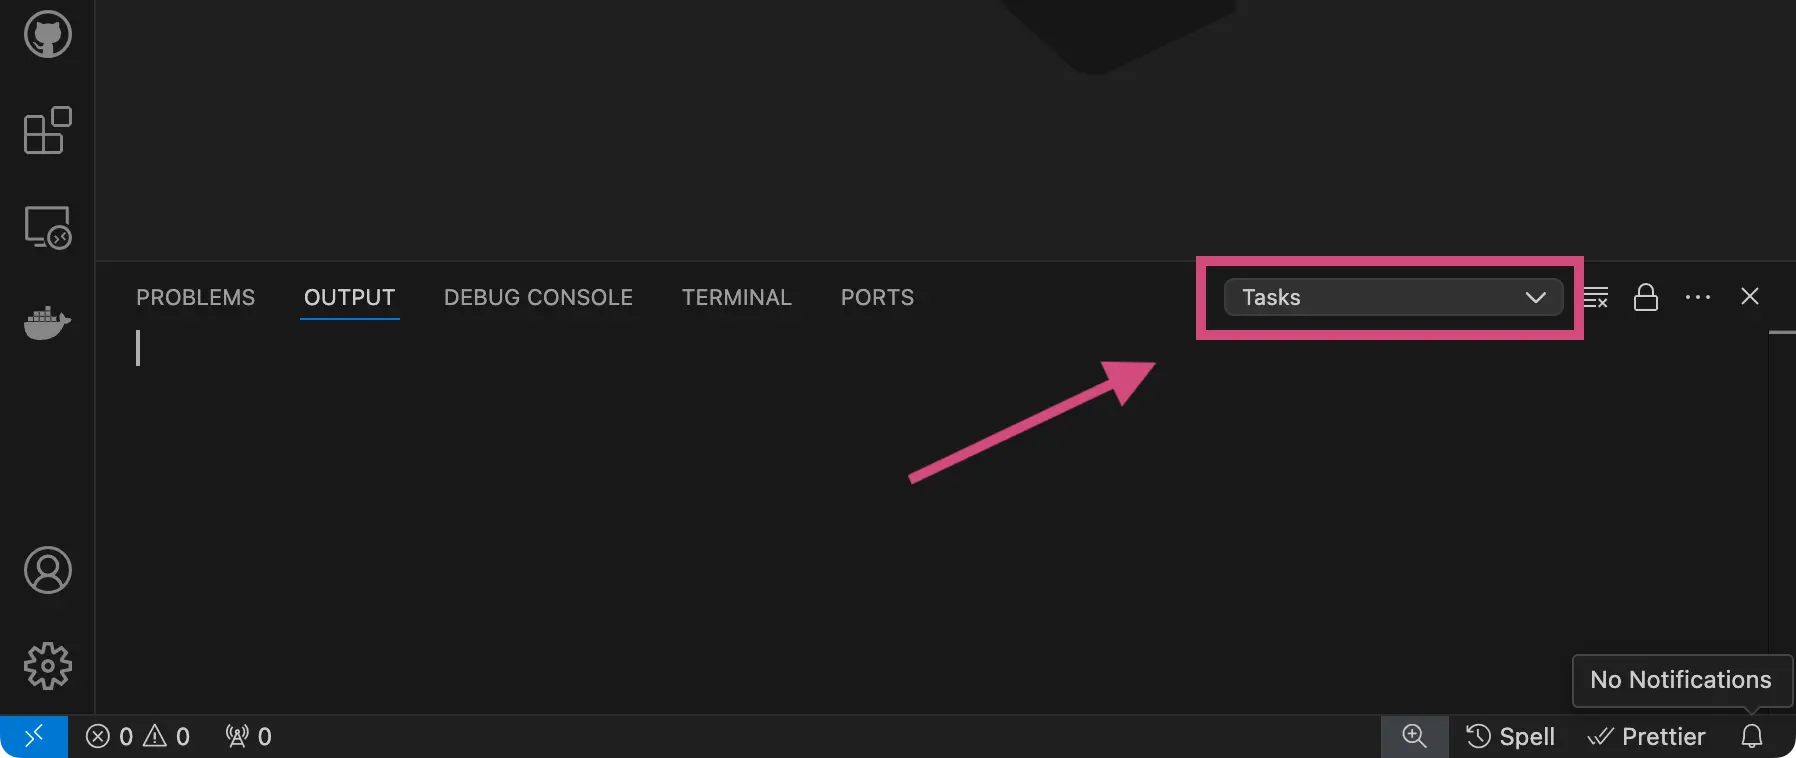
Click on the output log dropdown in the right corner to view a list of all the available output logs.
Select on the
AppMap: Serviceslog to view the logs from Navie.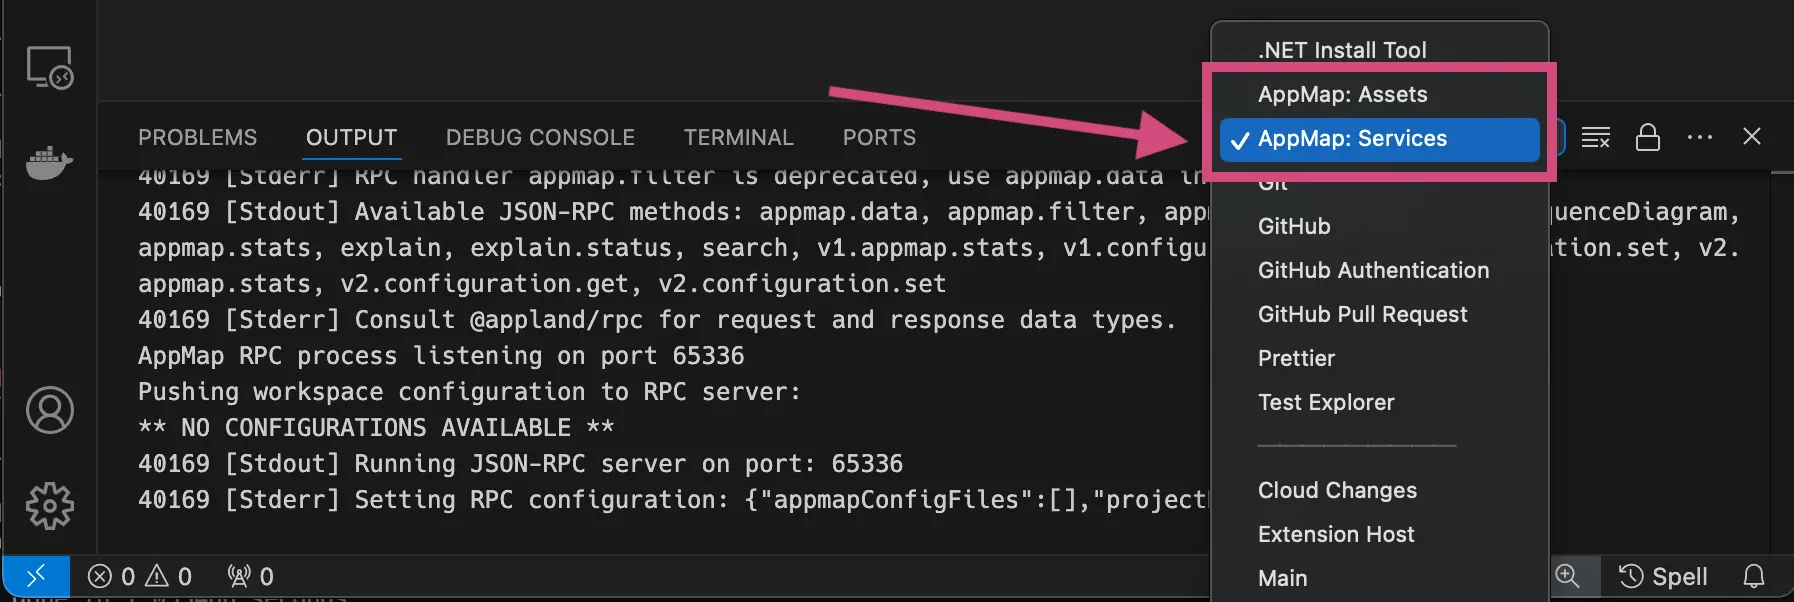
JetBrains
You can enable debug logging of Navie in your JetBrains code editor by first opening
Help>Diagnostic Tools>Debug Log Settings.
In the
Custom Debug Log Configurationenterapplandto enable DEBUG level logging for the AppMap plugin.
Next, open
Help>Show Log...will open the IDE log file.
Thank you for your feedback!
