To access the latest features keep your code editor plug-in up to date.
-
Docs
-
Reference
- AppMap for Visual Studio Code
- AppMap for JetBrains
- AppMap Agent for Ruby
- AppMap Agent for Python
- AppMap Agent for Java
- AppMap Agent for Node.js
- AppMap for Java - Maven Plugin
- AppMap for Java - Gradle Plugin
- Command line interface (CLI)
- Remote recording API
- Analysis Labels
- Analysis Rules
- License Key Installation
- Subscription Management
- AppMap Offline Install for Secure Environments
- Uninstalling AppMap
Advanced AppMap Data Management- Using AppMap Diagrams
- Navigating Code Objects
- Exporting AppMap Diagrams
- Handling Large AppMap Diagrams
- Reading SQL in AppMap Diagrams
- Refining AppMap Data
- Generating OpenAPI Definitions
- Using AppMap Analysis
- Reverse Engineering
- Record AppMap Data in Kubernetes
Integrations- Community
Navie Commands
You can ask free-form questions, or start your question with one of these commands:
@explain
The
@explaincommand prefix within Navie serves as a default option focused on helping you learn more about your project. Using the@explainprefix will focus the Navie AI response to be more explanatory and will dive into architectural level questions across your entire code base. You can also use this to ask for ways to improve the performance of a feature as well.Examples
- @explain how does user authentication work in this project?
- @explain how is the export request for physical flows handled, and what are the tables involved?
- @explain how does the products listing page works and how can I improve the performance?
@diagram
The
@diagramcommand prefix within Navie focuses the AI response to generate Mermaid compatible diagrams. Mermaid is an open source diagramming and charting utility with wide support across tools such as GitHub, Atlassian, and more. Use the@diagramcommand, and Navie will create and render a Mermaid compatible diagram within the Navie chat window. You can open this diagram in the Mermaid Live Editor, copy the Mermaid Definitions to your clipboard, save to disk, or expand a full window view. Save the Mermaid diagram into any supported tool such as GitHub Issues, Atlassian Confluence, and more.Navie generates the following types of diagrams:
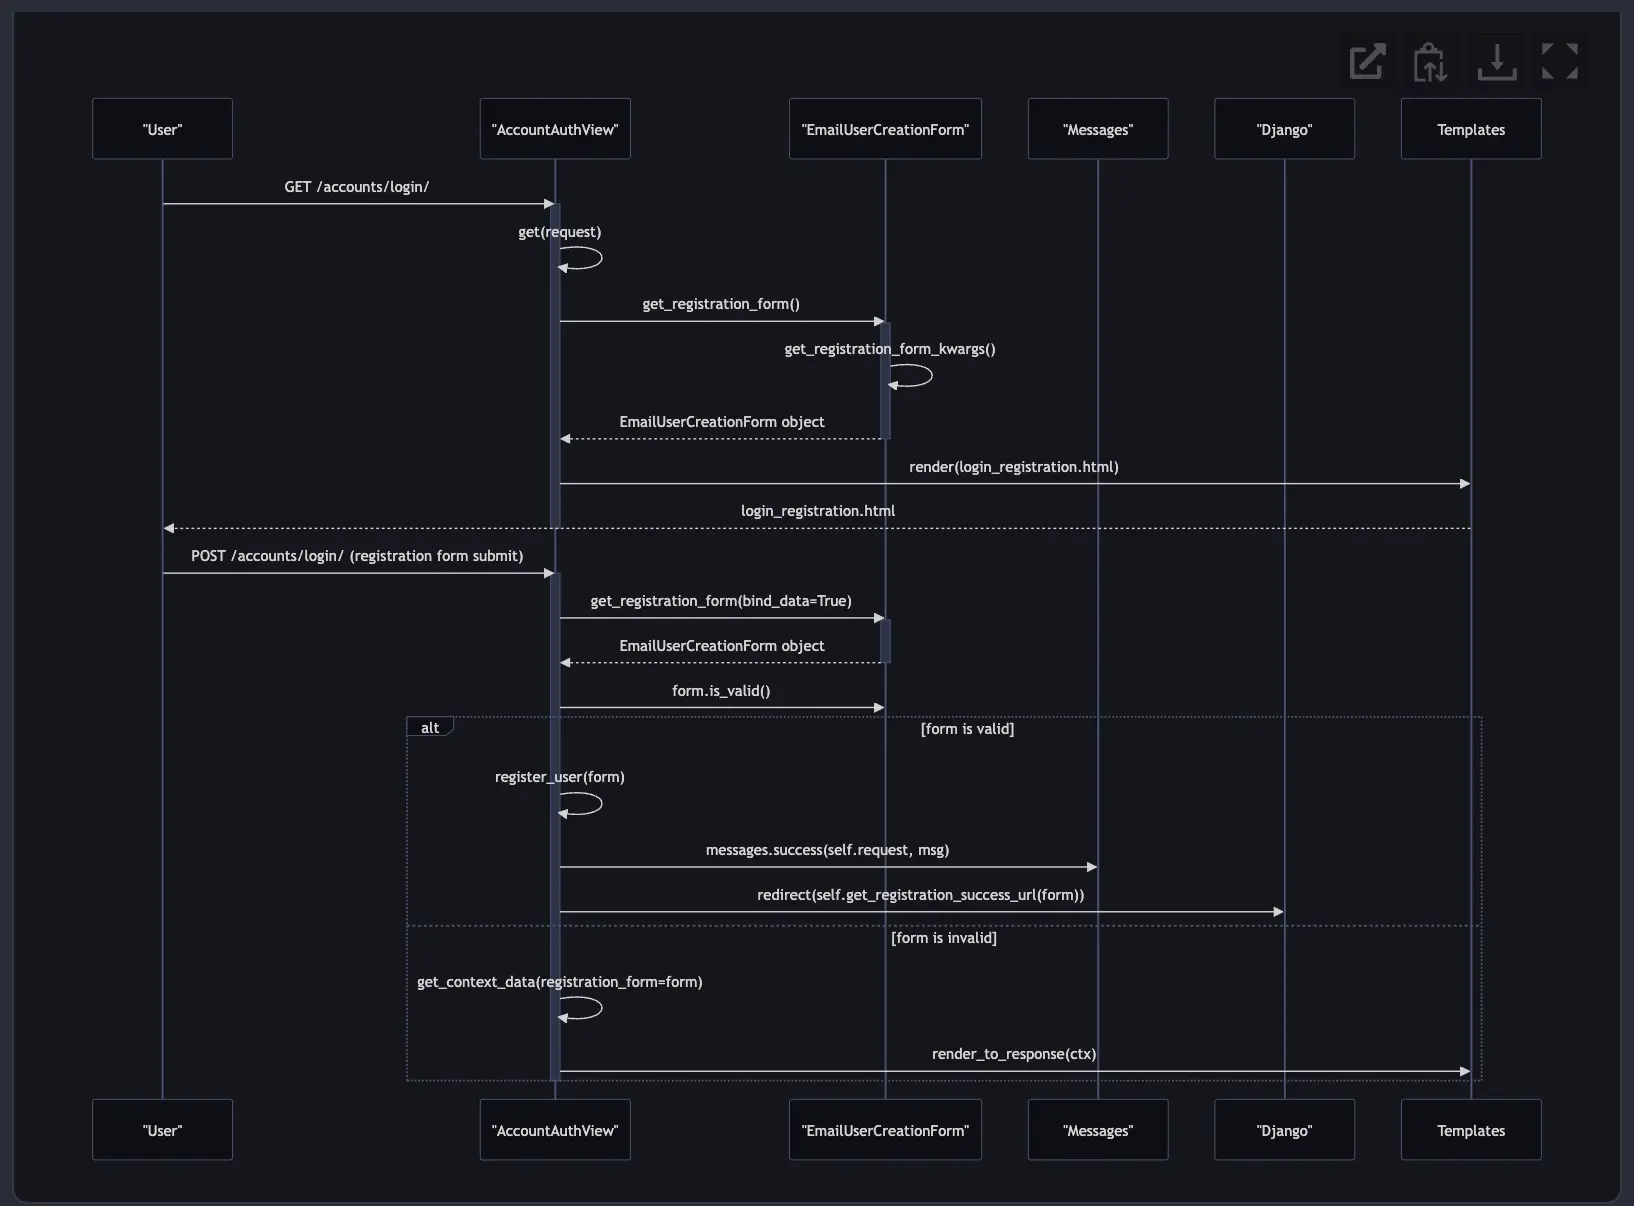
Sequence Diagram
Why Use a Sequence Diagram:
- Enhanced Understanding: Sequence diagrams offer a clear visualization of an application’s runtime behavior, making it easier for developers to analyze and understand complex workflows and interactions within the codebase.
- Refactoring and Debugging: These diagrams assist in identifying code smells and help developers refactor messy code into more logical patterns.
- Documentation: They act as living documentation, helping maintain up-to-date insights into the system’s architecture and facilitating easier onboarding for new team members.
Why Share with Team Members:
- Collaboration: Sharing sequence diagrams helps facilitate discussions during design or planning meetings, as everyone can see the same visualization of the application’s behavior.
- Knowledge Sharing: By embedding these diagrams into documentation or presentations, team members gain a better understanding of the system, which is particularly useful when passing on knowledge or updating team members on recent changes.
- Improved Communication: The diagrams can be shared to ensure all team members, regardless of their experience level or familiarity with the project, have a clear and consistent understanding of the code’s execution flow.
Example Questions
- Interaction Flow: How can the sequence diagram illustrate the interaction flow between objects or components during a user login process?
- Message Passing: What messages are exchanged between system components, and how are they ordered and timed within the sequence diagram?
- Method Invocation Details: How does the diagram represent method invocations and the sequence of method calls required to execute a payment transaction?
- Complex Workflow Mapping: What steps are involved in a complex workflow, such as order processing, and how are they sequenced and interrelated?
- Error Handling in Sequences: How are errors or exceptions captured and managed within the sequence flow, especially during external API calls?
- User Interaction Viewpoint: From a user’s perspective, how does the sequence diagram outline the steps taken and responses received when interacting with a specific feature or service?
Entity Relationship Diagram (ERD)
Why Use an Entity Relationship Diagram:
- Data Structure Visualization: ERDs provide a clear graphical representation of the database structure, illustrating entities, attributes, and relationships. This helps developers understand the organization of data within the system.
- Database Design: ERDs are instrumental in designing databases by helping identify what tables are needed and how they interrelate. They ensure a well-structured and efficient database design process.
- Analysis and Modeling: ERDs assist in the logical analysis and modeling of data requirements, ensuring that the database structure aligns with business processes and rules.
Why Share with Team Members:
- Collaboration on Design: Sharing ERDs among team members fosters collaboration on database design, as individuals can discuss and provide input on the data model.
- Knowledge Sharing: Team members can use ERDs to better understand the database schema, especially useful for new developers onboarding or when transferring a project.
- Improved Communication: ERDs serve as an effective communication tool among developers, database administrators, and stakeholders, providing a common understanding of how data is structured and accessed.
Example Questions
- Entity Relationships: How are the entities related to each other, and what types of relationships (e.g., one-to-one, one-to-many) exist between them?
- Key Attributes Identification: What are the key attributes of each entity, and how are they represented to define the unique aspects of each entity?
- Relationship Constraints: What constraints, such as foreign keys or unique constraints, govern the relationships between entities in the database?
- Normalization: How does the diagram illustrate the normalization of database tables to reduce redundancy and improve data integrity?
- Cardinality and Participation: How are cardinality (e.g., zero, one, many) and participation (e.g., optional, mandatory) represented in the relationships?
- Domain Modeling: How does the ERD represent domain-specific models by aligning real-world entities with their database counterparts?

Entity Relationship Diagram Video Demo
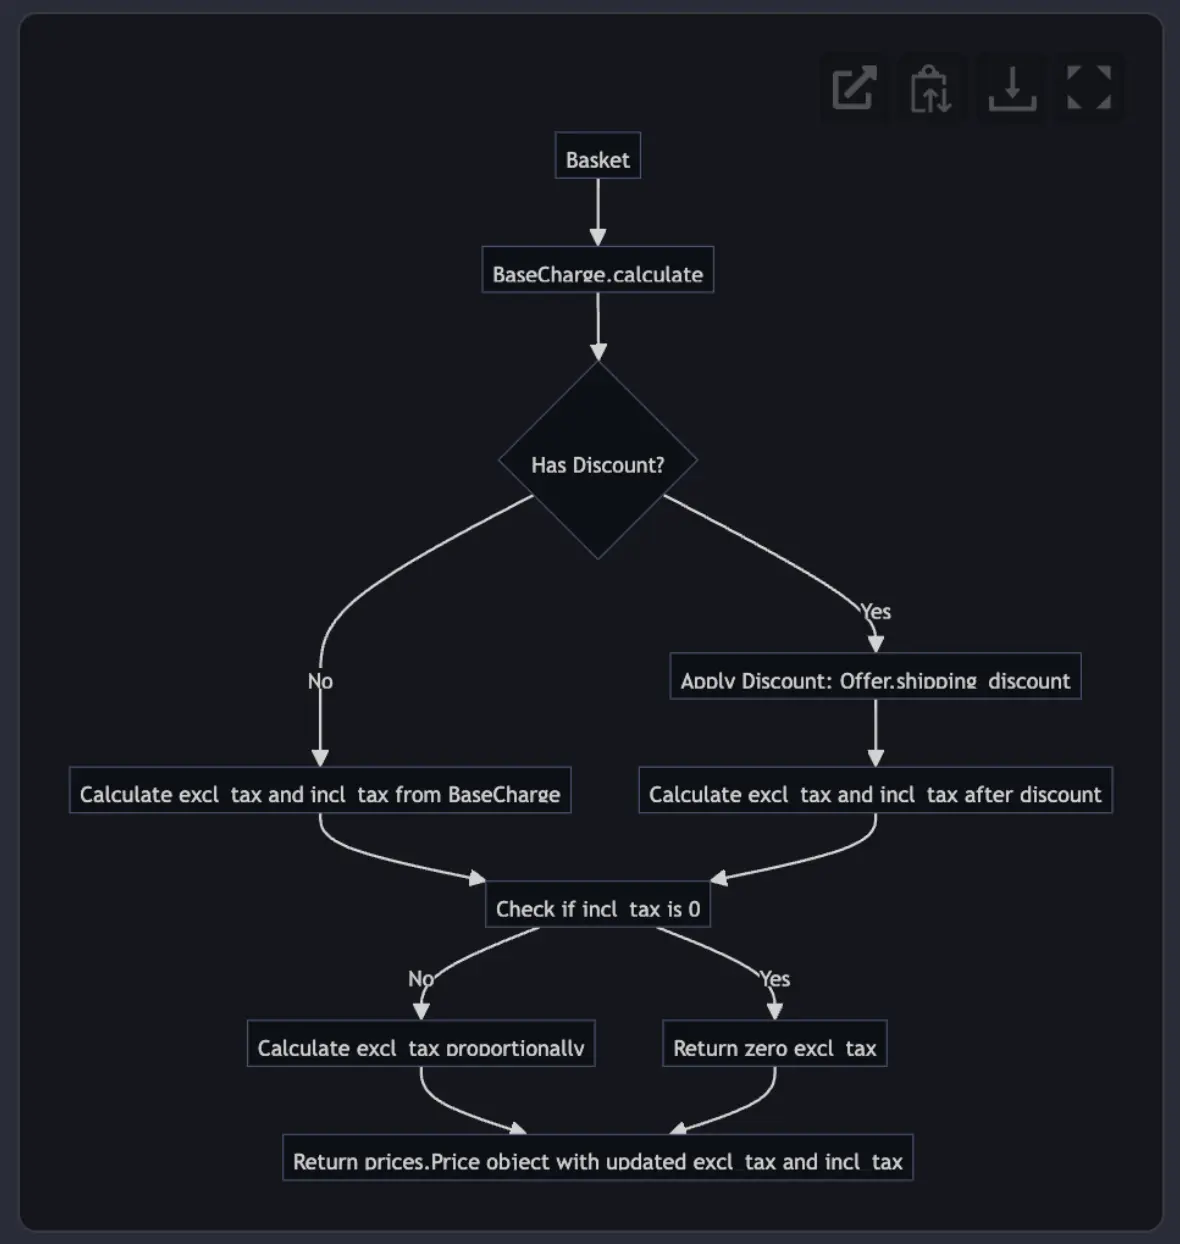
Flow Chart
Why Use a Software Process Flow Chart:
- Visualizing Processes: Flowcharts provide a straightforward and visual method for representing complex processes, making it easier to understand workflows, decision points, and sequences of operations within a system.
- Identifying Inefficiencies: By visualizing the entire process, flowcharts can highlight bottlenecks or inefficiencies, aiding in process optimization and improvement efforts.
- Ensuring Consistency: They help ensure that processes are consistently applied and adhered to by providing a visual guideline or standard operating procedure.
Why Share with Team Members:
- Facilitating Collaboration: Sharing flowcharts supports collaborative efforts by giving all team members a clear understanding of the process, enabling them to align their efforts and make informed suggestions for improvements.
- Knowledge Sharing and Onboarding: Flowcharts can be utilized to educate new team members on existing processes, ensuring that knowledge about workflows is easily communicated and retained.
- Unified Communication: They provide a unified view that can be shared across different teams or departments, ensuring that everyone has the same understanding of the process and eliminating misunderstandings.
Example Questions
- Process Visualization: How can the flowchart depict the overall process of user registration, including decision points and sequential actions?
- Efficiency Identification: What are the potential bottlenecks or inefficiencies within the process, and how can they be identified through the flowchart?
- Error Pathways: How does the flowchart illustrate the error handling pathways and recovery steps within the system?
- Conditional Logic: What conditional logic is included in the decision-making process, and how is it represented in the flowchart?
- Sequential Operations: How does the flowchart outline the step-by-step operations necessary to complete a specific business task or feature within the application?
- Cross-Departmental Workflows: How does the flowchart illustrate the interaction between different departments or teams in a multi-step process?
Class Diagram
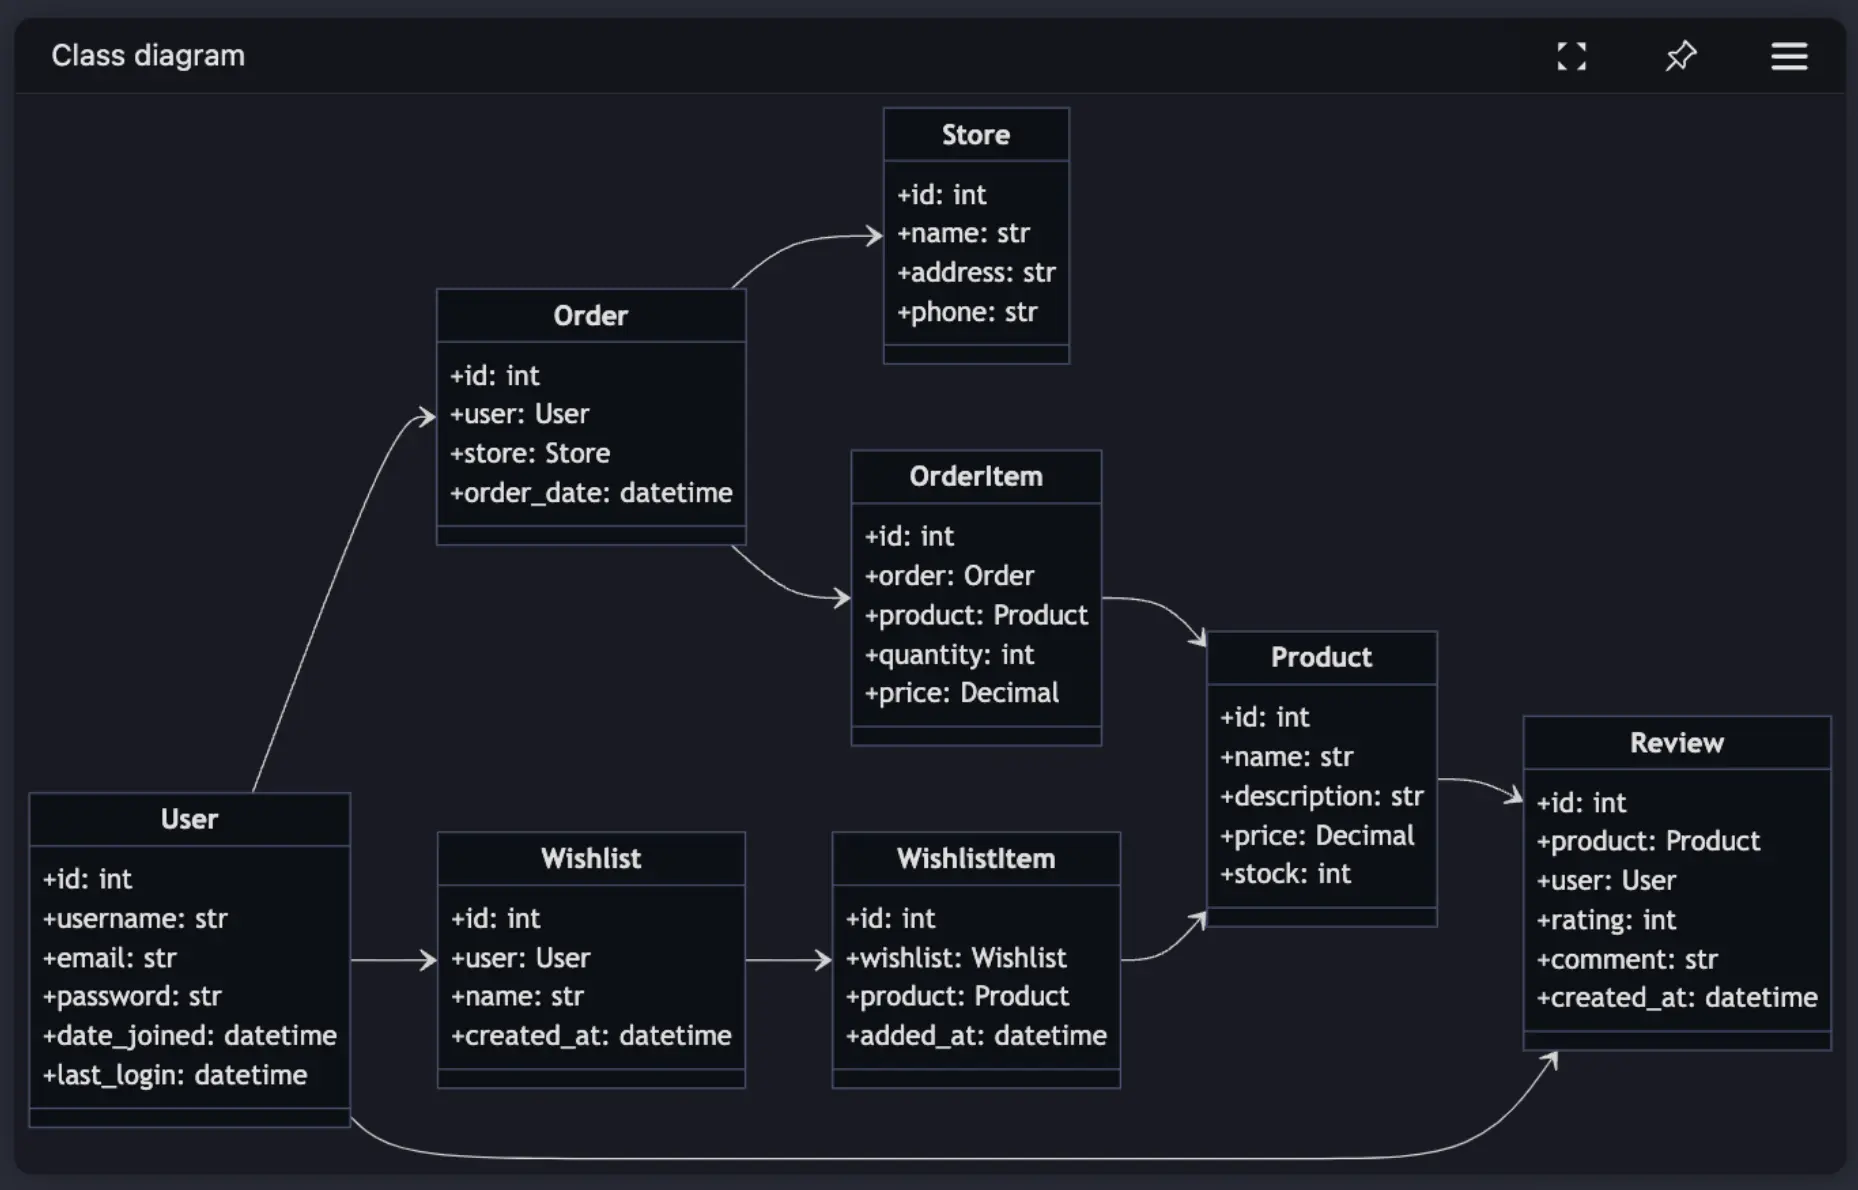
Why Use a Class Diagram:
- Blueprint of System Structure: Class diagrams provide a blueprint of the system’s structure by showing classes, their attributes, methods, and the relationships between them. This aids in visualizing how the system is organized at a glance.
- Design and Refactoring: They support the design phase by allowing architects and developers to plan class structures and relationships. They are also useful in refactoring efforts by providing a clear view of dependencies.
- Documentation: Class diagrams act as precise documentation of the system’s architecture, capturing detailed design choices that can be referred to throughout the development lifecycle.
Why Share with Team Members:
- Collaborative Design: Sharing class diagrams enables collaborative design and decision-making, allowing team members to propose improvements or identify the best design patterns collectively.
- Onboarding and Knowledge Transfer: New team members can quickly get up to speed with the system’s architecture through class diagrams, facilitating efficient onboarding and knowledge transfer among team members.
- Unified Understanding: By providing a common representation of the system’s architecture, class diagrams ensure that all stakeholders, including developers, designers, and management, have a unified understanding of the system.
Example Questions
- Primary Class Identification: What are the primary classes involved in the core functionality of the application, such as authentication or user management?
- Class Interactions: How do specific classes interact with each other, and what are the dependencies that exist between them within the application?
- Inheritance Hierarchies: What inheritance hierarchies are defined in the system, and how do they influence the behavior and relationship of classes?
- Domain-Specific Associations: How are the important domain-specific entities structured, and what are their relationships, in terms of associations and aggregations?
- External Component Interfaces: How do classes act as interfaces to external components or APIs, and what are the key methods defined for these interactions?
- Design Pattern Implementation: What design patterns are applied to the class structures, and how do these patterns enhance or streamline the application’s functionality?
These questions will guide the creation of a class diagram that illuminates the organizational structure of the system, helping to understand both the high-level and detailed design choices.
State Diagram
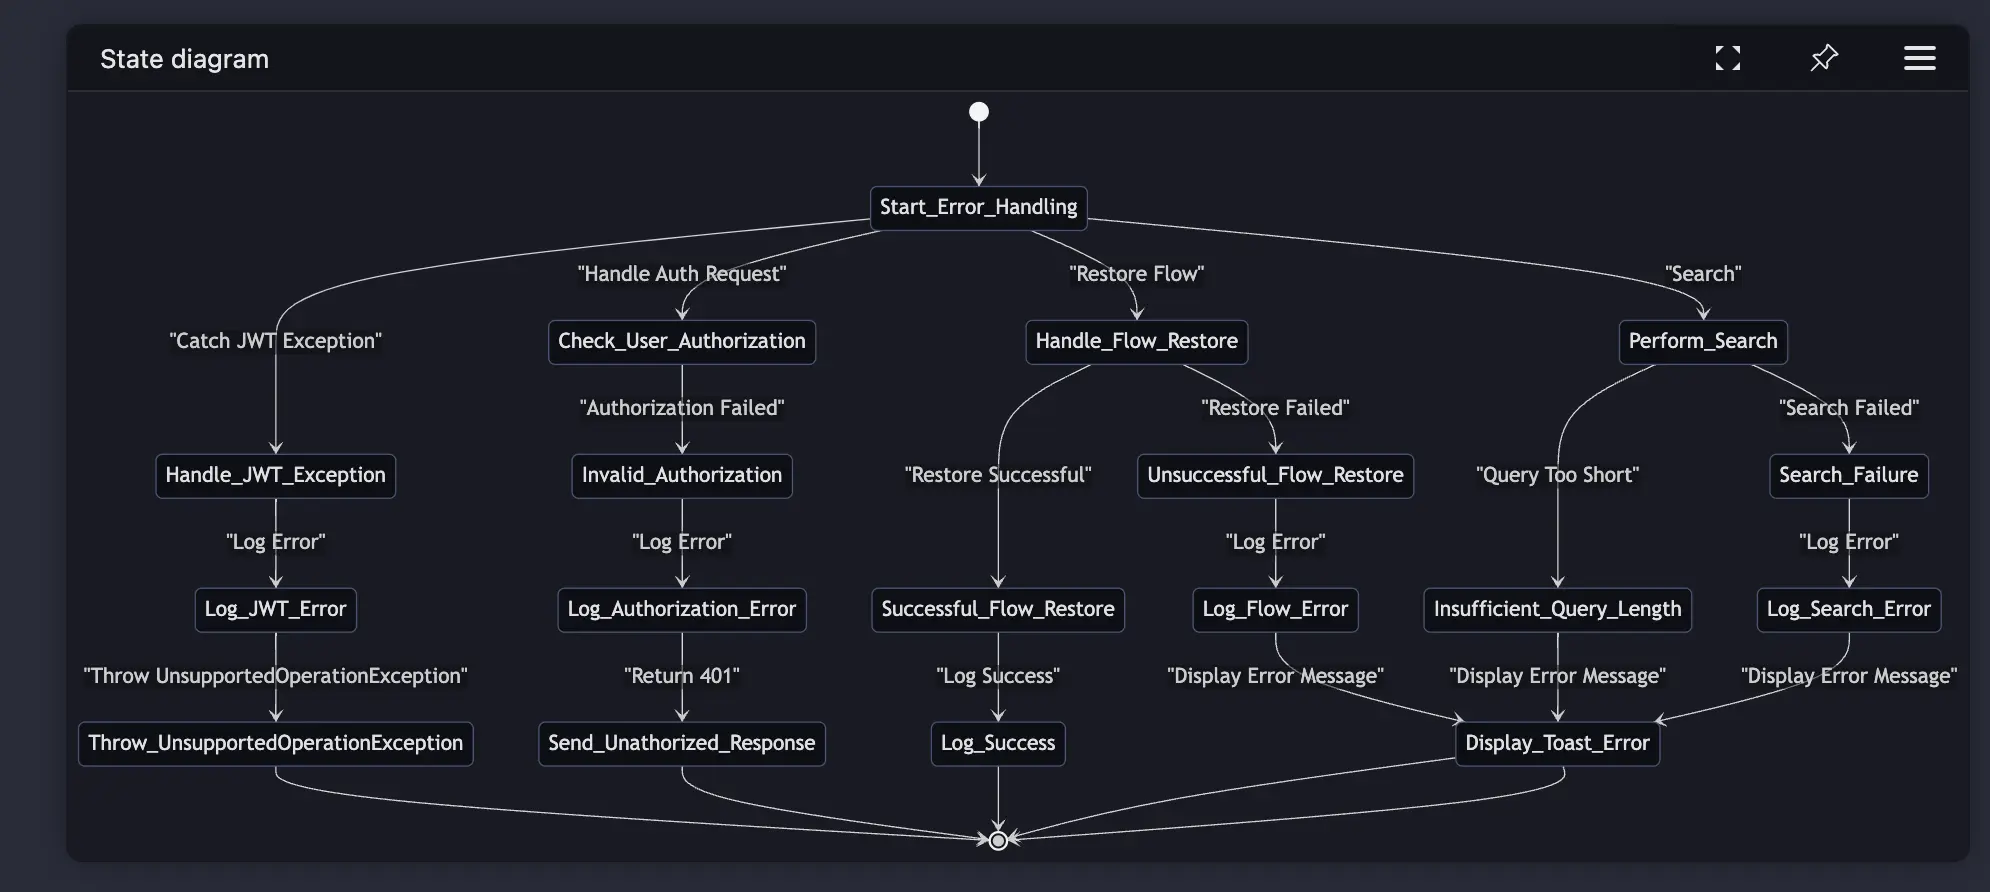
Why Use a State Diagram:
- Understanding State Transitions: State diagrams are excellent for visualizing the various states an object or system can be in and the transitions between these states, which helps in understanding dynamic behavior.
- Designing Complex Workflows: By outlining states and transitions, developers can map out complex workflows, ensuring that all possible scenarios are accounted for and logically sequenced.
- Debugging and Error Handling: State diagrams aid in identifying and handling errors by illustrating how the system should respond to various inputs or events, thereby enhancing robustness.
Why Share with Team Members:
- Facilitating Collaboration: Sharing state diagrams helps align team understanding on how the system should behave in various states, fostering more effective collaboration in design and implementation.
- Knowledge Transfer and Onboarding: New team members can use state diagrams to quickly get up to speed with the system’s operational flow, facilitating easier onboarding and knowledge transfer.
- Unified Understanding: They provide a cohesive view of how components or systems behave, ensuring that all stakeholders, including developers and business analysts, have a unified understanding of the system’s behavior.
Example Questions
- Authentication Flow States: How does the authentication flow handle different states of a user session, such as logged in, logged out, or session expired?
- Request Lifecycle: What are the different states a request goes through from when it is received until it is fully processed or fails?
- Error Handling Procedures: What states are involved in the error handling process, and how does the system transition between different error states?
- User Session Management: How are user sessions managed and transitioned between states such as active, inactive, and expired?
- State Transitions in Business Logic: What are the state transitions involved in specific business processes, such as order processing or data validation?
- Resource State Transitions: How do resources change states in response to different events, such as a database update or a successful API call?
Example Diagram Projects
Below are a series of open source projects you can use to try out the
@diagramfeature using prebuilt AppMap data in a sample project. Simply clone one of the following projects, open into your code editor with the AppMap extension installed, and ask Navie to generate diagrams.@search
The
@searchcommand in Navie is a powerful tool for navigating complex codebases with ease. By leveraging smart search capabilities, you can locate specific code elements, relevant modules, or examples directly within the AppMap environment.Key Features
-
Intelligent Query Processing: The
@searchcommand uses a smart agent to interpret queries, identifying and retrieving relevant code segments based on context. - Formatted Results: Search results are organized into clickable Markdown links, enabling direct access to pertinent code files or sections.
- Customizable Display Options: Output can be tailored to user preferences, allowing flexible formatting options for improved readability.
Using @search
-
Start a Search: Type the
@searchcommand followed by your query. - Specify Context: Provide descriptive keywords or phrases to refine the search, improving accuracy and relevance of results.
- Review and Navigate: The command returns a list of links, each accompanied by a brief summary to help users quickly identify and access the most relevant files.
@plan
The
@plancommand prefix within Navie focuses the AI response on building a detailed implementation plan for the relevant query. This will focus Navie on only understanding the problem and the application to generate a step-by-step plan. This will generally not respond with code implementation details, consider using the@generatecommand which can implement code based on the plan.Examples
- @plan improve the performance of my slow product listing page.
- @plan implement a cache key for my user posting on my social media application.
- @plan migrate the /users/setting API endpoint from SQL to MongoDB.
@planVideo Demo@generate
The
@generateprefix will focus the Navie AI response to optimize for new code creation. This is useful when you want the Navie AI to respond with code implementations across your entire code base. This will reduce the amount of code explanation and generally the AI will respond only with the specific files and functions that need to be changed in order to implement a specific plan.Examples
- @generate Using the django-simple-captcha library add the necessary code for an offline captcha to my new user registration page.
- @generate Update the function for the physical flow export to include data type via physical_spec_data_type and physical_specification tables without changing the existing functionality.
- @generate Design and implement a cache key for user posts and show me how to implement it within this code base
@generateVideo Demo@test
The
@testcommand prefix will focus the Navie AI response to optimize for test case creation, such as unit testing or integration testing. This prefix will understand how your tests are currently written and provide updated tests based on features or code that is provided. You can use this command along with the@generatecommand to create tests cases for newly generated code.Examples
- @test create integration test cases for the user setting page that is migrated to mongodb.
- @test create unit and integration tests that fully support the updated cache key functionality.
- @test provide detailed test cases examples for testing the updated user billing settings dashboard.
@review
The
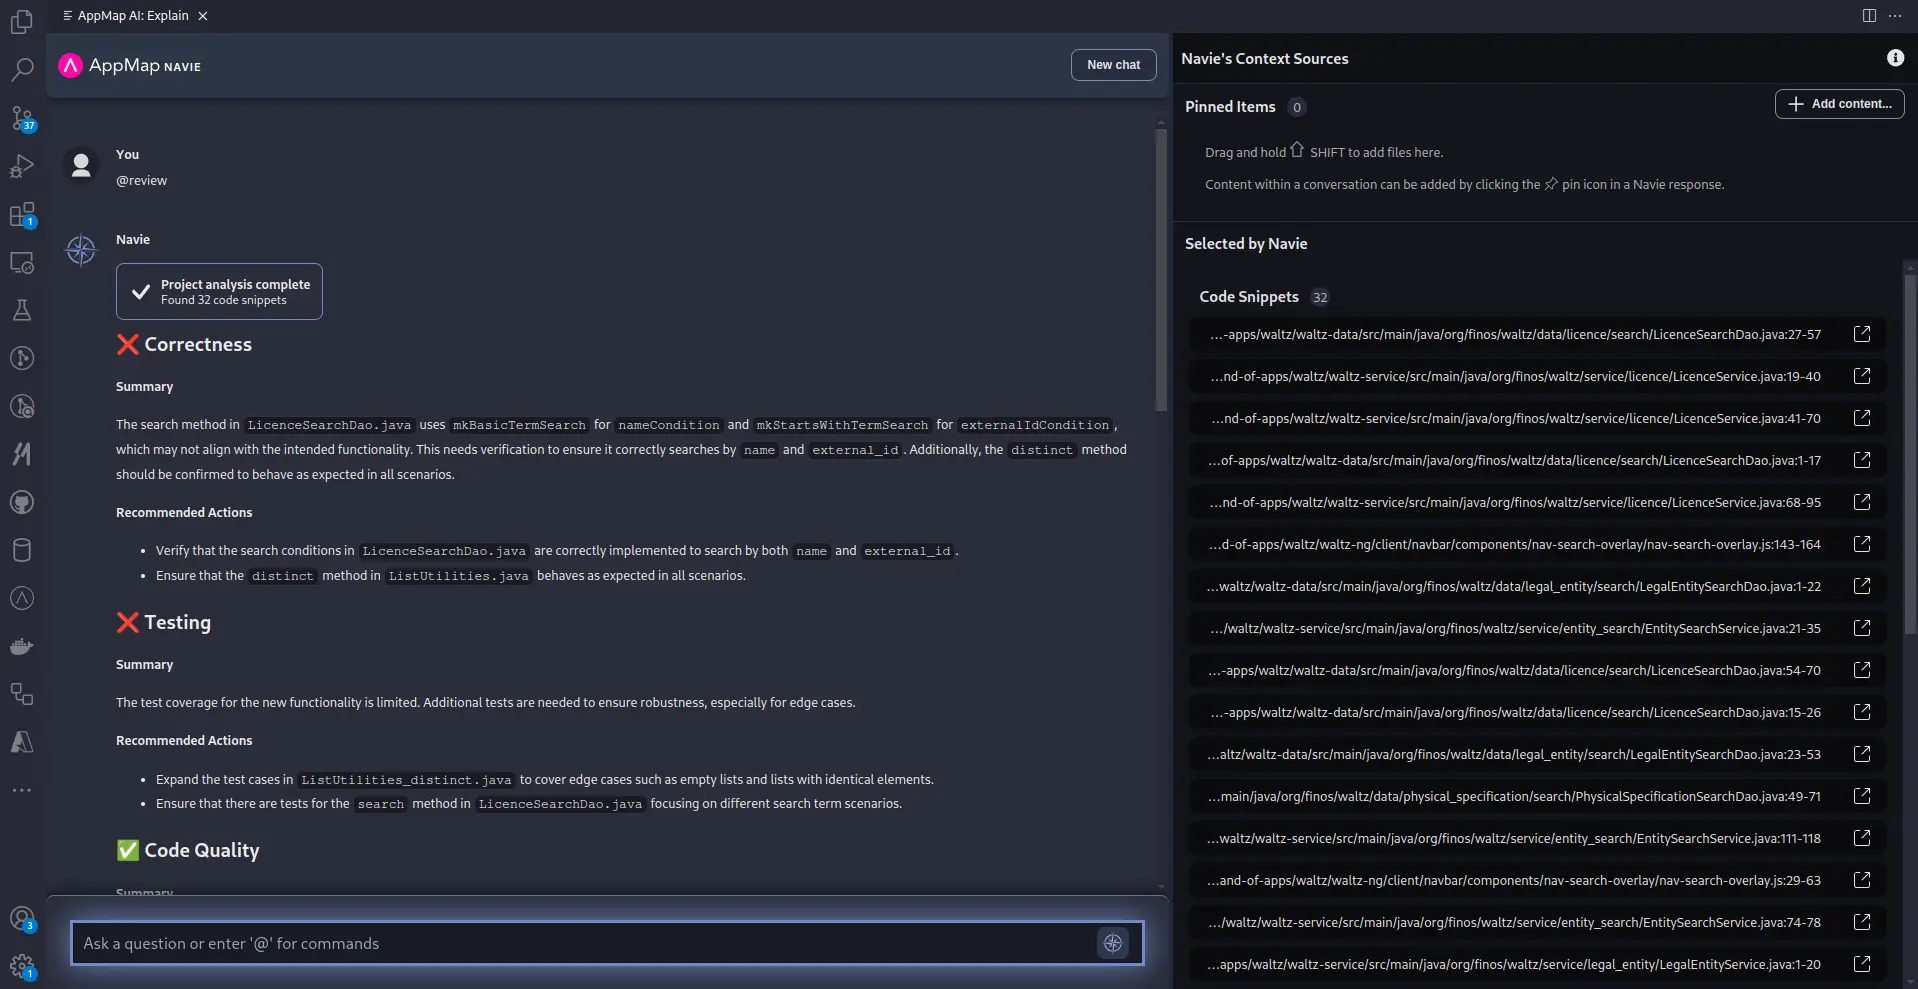
@reviewcommand is designed to facilitate thorough code change analysis, leveraging Large Language Models (LLMs) to generate a code diff review that aligns with recognized software engineering standards. This command provides actionable insights on various aspects of code, ensuring alignment with best practices in areas such as code quality, security, and maintainability. Additionally, it allows users to enhance the review by pinning context specific architectural guidelines or design documentation relevant to their project. Navie structures each aspect of the review into actionable sections, clearly highlighting areas of improvement and best practice recommendations.Navie by default will compare themainbranch of your repository with the currentHEADof your branch. If your source branch is a different name, adjust the review command using the/basecommand. Example:@review /base=masterKey Features
-
Automated Code Diff Generation: The
@reviewcommand automatically generates agit difffor your code changes, preparing them for a detailed, AI-driven review. -
Comprehensive Standards Check: The review encompasses critical software engineering principles, including:
- Correctness: Ensuring logical accuracy and reliability of the code.
- Code Quality: Reviewing syntax, structure, and adherence to best coding practices.
- Performance: Highlighting areas that could impact performance and suggesting optimizations.
- Security: Identifying potential vulnerabilities or security concerns.
- Documentation: Assessing if the changes are sufficiently documented to maintain readability and usability.
- Testing: Reviewing test coverage and proposing relevant test cases if needed.
- Compatibility: Ensuring the changes are compatible with existing code structures and dependencies.
- Design: Evaluating if the code adheres to architectural principles and design patterns relevant to the project.
- Custom Contextualization: Users can pin internal architectural choices or specific design documents to guide Navie’s understanding, ensuring that feedback aligns with unique project requirements.
How to Use
-
Initiate a Review: Simply enter the
@reviewcommand in the Navie chat window to start.Note: Add/base=[branch]to change the name of the source branch you'd like to compare, default ismainExample:@review /base=master - Add Project-Specific Context (Optional): To enhance the accuracy of the review, pin architectural guidelines, design patterns, or other project-specific documentation into the Navie chat window.
- Receive Structured Feedback: Navie returns the code review in a structured, easy-to-read format, outlining suggestions and improvements by category.
@help
Navie will help you setup AppMap, including generating AppMap recordings and diagrams. This prefix will focus the Navie AI response to be more specific towards help with using AppMap products and features. This will leverage the AppMap documentation as part of the context related to your question and provide guidance for using AppMap features or diving into advanced AppMap topics.
Examples
- @help how do I setup process recording for my node.js project?
- @help how can I reduce the size of my large AppMap Data recordings?
- @help how can i export my AppMap data to atlassian confluence?
Thank you for your feedback!
